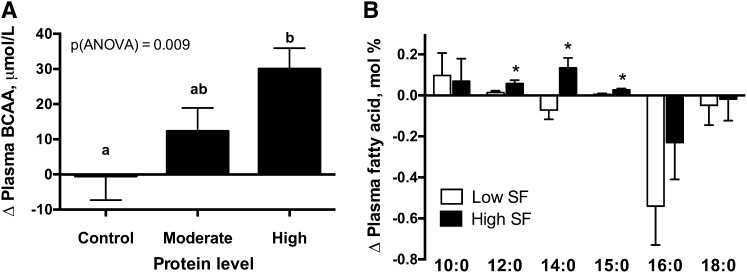
FIGURE 2.
Changes in plasma concentrations of BCAAs (A) and SFAs (B) in overweight and obese adults after 4 wk of consuming diets containing different amounts of protein and SF. Data from high-SF and low-SF diets were combined for each protein group (control: n = 31; moderate: n = 59; high: n = 68), and data from moderate- and high-protein diets were combined for each SF group (low SF: n = 66; high SF: n = 61). Values are means ± SEs. Groups without a common letter are significantly different, P < 0.05 (A). *Different from low-SF diet, P < 0.05 (B). SF, saturated fat.

