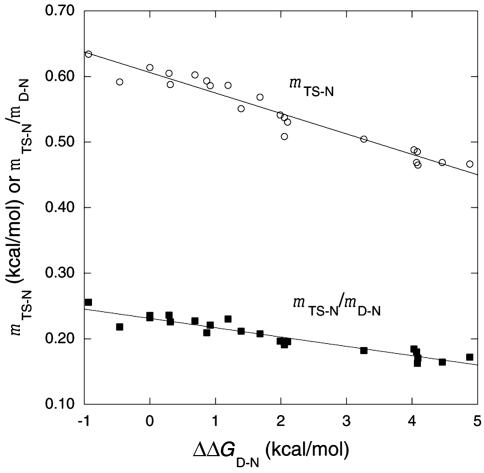
Fig. 8.
Plots of data relating surface exposure on denaturation kinetics of barnase. mTS-N is the slope of the plot of ΔGTS-N versus [urea], and mD-N is the slope of the plot of ΔGD-N versus [urea]. mTS-N is the value at 7.25 M urea, measured for unfolding data acquired between 6 and 8.5 M urea, and it is accurate to ±2%. The ratio of mTS-N/mD-N is a measure of the relative solvent exposure of the transition state to the denatured state. The value of mTS-N is a function of just the difference in solvent-accessible surface area of TS and N and does not depend on the properties of the denatured state.

