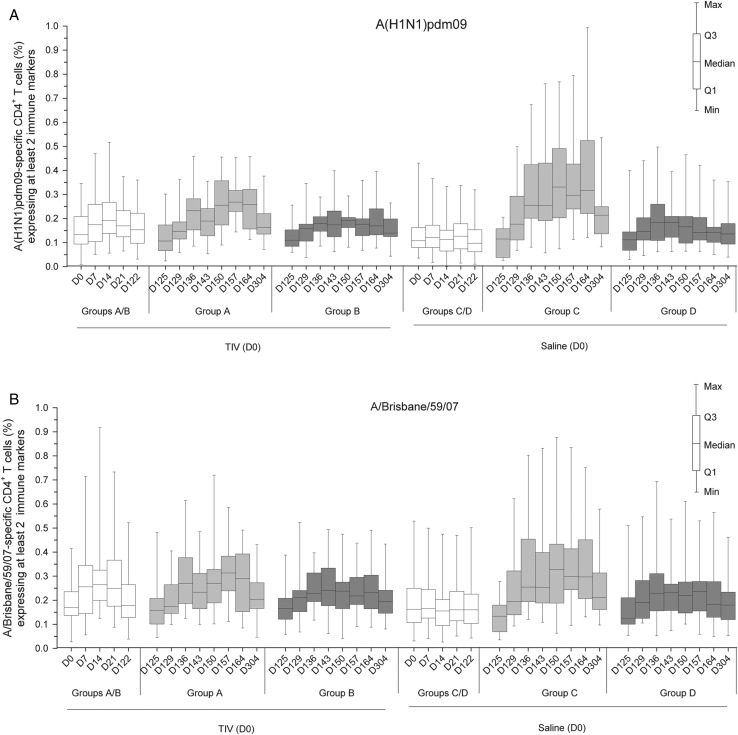
Figure 4.
Frequency of A(H1N1)pdm09-specific and A/Brisbane/59/2007-specific CD4+ T cells expressing at least 2 immune markers. Data shown are of the according-to-protocol cohort for immunogenicity at day 304. Group A received trivalent seasonal influenza vaccine (TIV) at day 0 and A(H1N1)pdm09 (3.75 µg)/AS03 at day 122 and day 143. Group B received TIV at day 0 and A(H1N1)pdm09 (15 µg) at day 122 and day 143. Group C received saline at day 0 and A(H1N1)pdm09 (3.75 µg)/AS03 at day 122 and day 143. Group D received saline at day 0 and A(H1N1)pdm09 (15 µg) at day 122 and day 143. Data are reported as the percentages of A(H1N1)pdm09-specific (A) or A/Brisbane/59/2007-specific (B) CD4+ T cells expressing (after in vitro stimulation) at least 2 immune markers among interferon-gamma, interleukin-2, tumor necrosis factor-alpha, and CD40L of all CD4+ T cells, with first and third quartiles, and the minimum/maximum values measured. Abbreviation: D, day.

