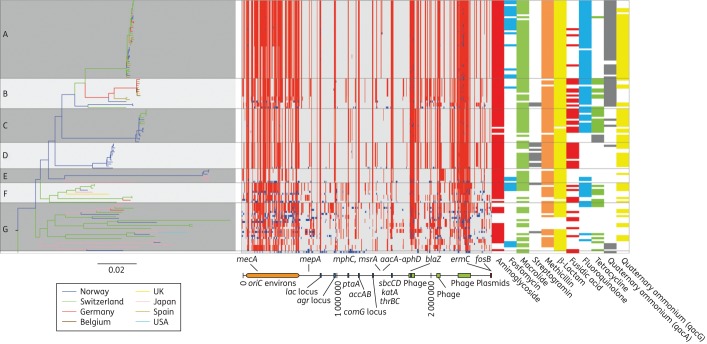
Figure 1.
Phylogeography, recombination map and antibiotic resistance distribution of S. haemolyticus. Left panel: a maximum likelihood tree constructed from substitutions in the core genome of S. haemolyticus. The branch length of the outgroup has been shortened by a factor of 100 for better resolution of the tree. Branches are coloured according to geographical location. Middle panel: the chromosomal location of recombinations detected in the collection of isolates relative to JCSC 1435. Red blocks are recombinations predicted to have occurred on an internal branch and are shared by multiple isolates through common descent. Blue blocks are recombinations predicted to have occurred on terminal branches and are present in only one strain. The annotations of highly variable areas are shown below. In the collection of isolates sequenced, variation predicted to be due to recombination was identified in regions mapping to 78.1% of the JCSC1435 chromosome. Right panel: distribution of antibiotic resistance. Coloured slots represent identified genotypes corresponding with resistance to the antibiotic class indicated below. This figure appears in colour in the online version of JAC and in black and white in the print version of JAC.

