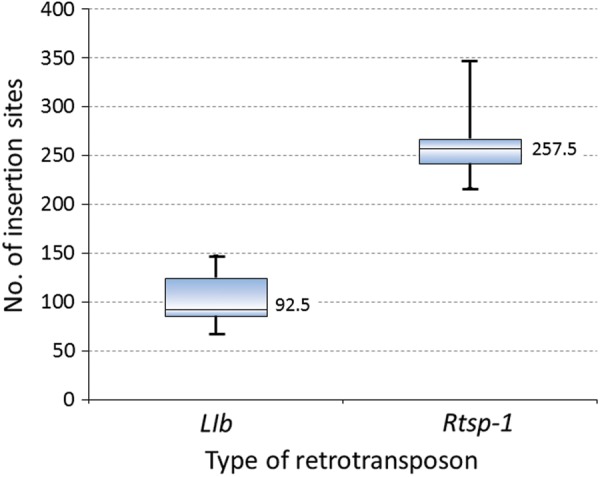
Figure 2.

The numbers of Rtsp_1 and LIb insertion sites identified in this study. The box plots show the distributions of these sites in the 38 cultivars. The central rectangle spans the first quartile to the third quartile. The line inside the rectangle shows the median number (257.5 and 92.5 for Rtsp-1 and LIb, respectively), and the whiskers above and below the box show the maximum and minimum number, respectively.
