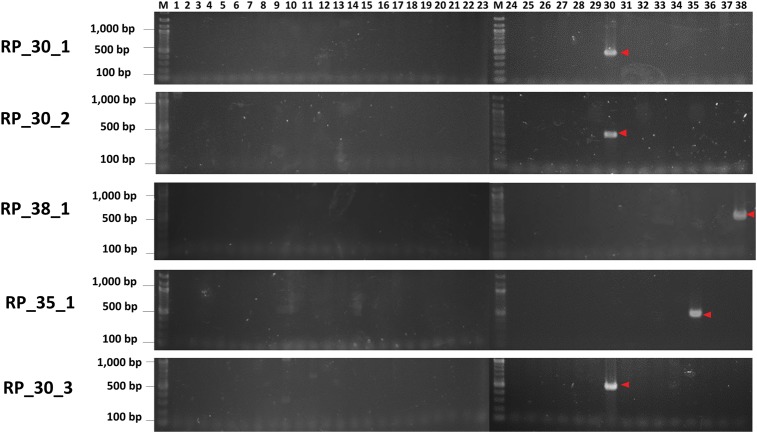
Figure 3.
Agarose gel image showing the SCAR markers developed in this study. PCR amplification was conducted using the cultivar-specific insertion primer (RP_*) and the Rtsp-1-specific primer (Rtsp-1_ppt). Descriptions of these primers are provided in Supplementary Table S2. The arrows indicate the strong and reproducible bands that were specific for each cultivar. Lanes 1–38 correspond to the cultivars listed in Supplementary Table S1.

