
Figure 3.
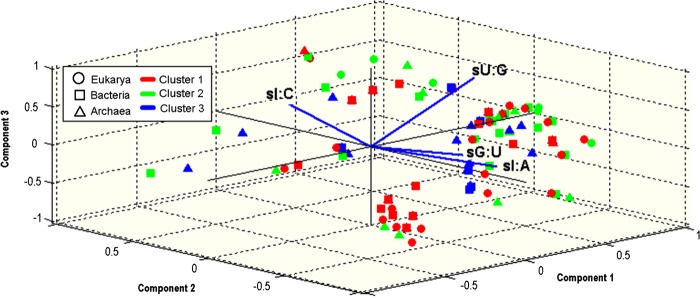
Principal component analysis (PCA) on the 100 different Sij sets demonstrates clustering of Sij according to evolutionary domains. The first three components of the PCA are presented. Each point in the figure represents one of the 100 analysed organisms; the shape of the point corresponds to the domain of the organism at the tree of life and the colour corresponds to the cluster the point was classified based on the k-means algorithm.