
Figure 5.
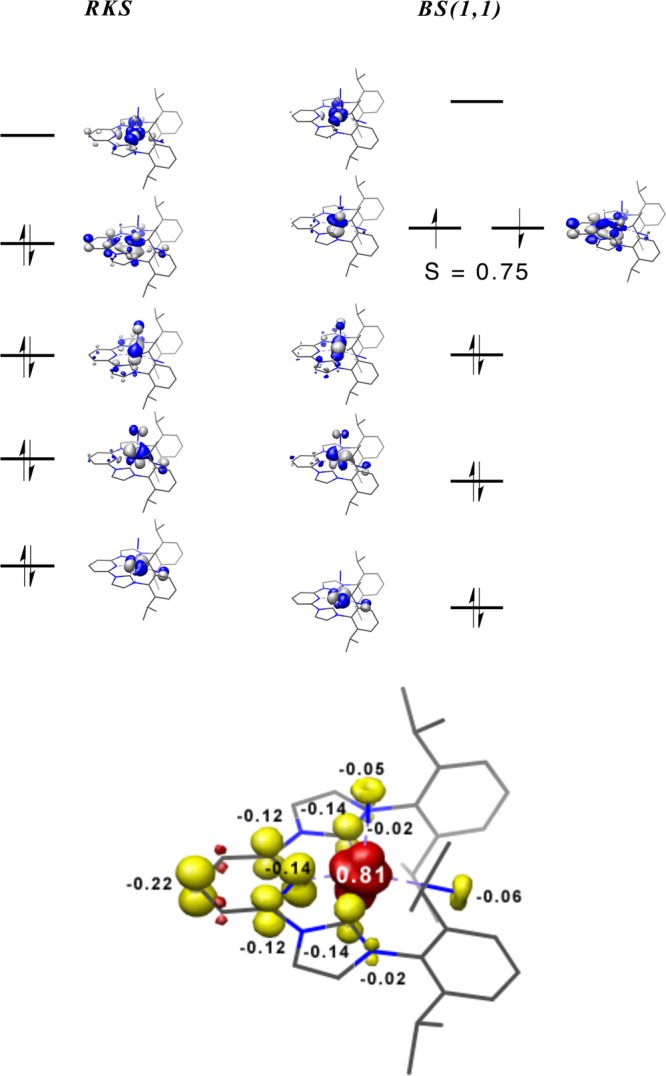
(top) Qualitative MO diagrams for (iPrCNC)Fe(N2)2 obtained from RKS (left) and BS(1,1) (right) DFT calculations at the B3LYP level . (bottom) Spin density plot for (iPrCNC)Fe(N2)2 obtained from the BS(1,1) solution.
Official websites use .gov
A
.gov website belongs to an official
government organization in the United States.
Secure .gov websites use HTTPS
A lock (
) or https:// means you've safely
connected to the .gov website. Share sensitive
information only on official, secure websites.
(top) Qualitative MO diagrams for (iPrCNC)Fe(N2)2 obtained from RKS (left) and BS(1,1) (right) DFT calculations at the B3LYP level . (bottom) Spin density plot for (iPrCNC)Fe(N2)2 obtained from the BS(1,1) solution.