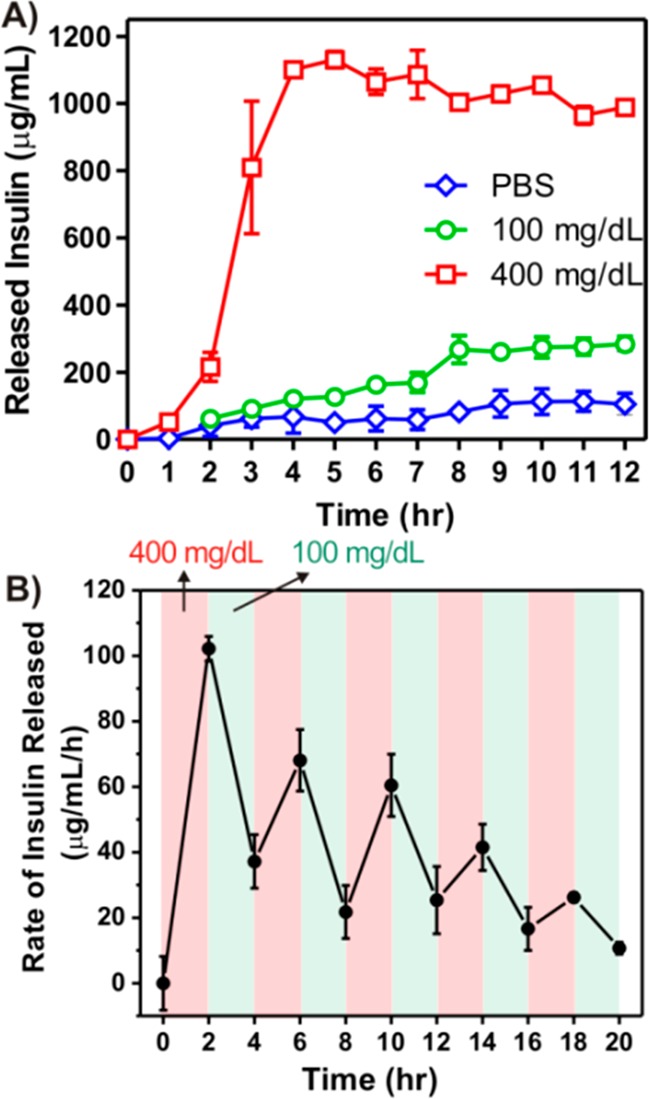
Figure 5.

Glucose responsive insulin release of the nanovesicles in vitro. (A) In vitro accumulated insulin release from the vesicles incubated in the solutions with different glucose concentrations. (B) Pulsatile release profile of vesicles presents the rate of insulin release as a function of glucose concentrations (100 and 400 mg/dL). Data points represent mean ± SD (n = 3).
