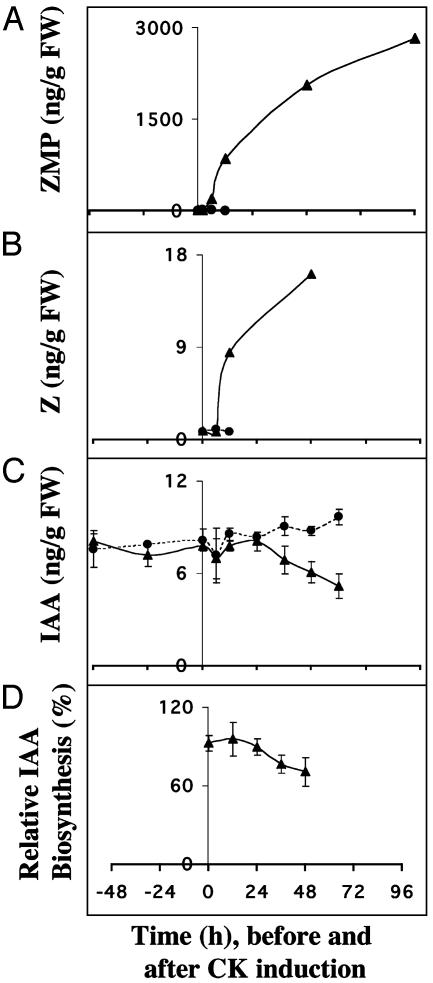
Fig. 3.
(A) Endogenous ZMP after induction of cytokinin biosynthesis (t = 0) in the inducible cytokinin overproducing line 3-2-1 (▴) and control (•). (B) Pool size of Z in WT plants (•) and the 3-2-1 line (▴) before and after induction of cytokinin synthesis. (C) Pool size of IAA in WT plants (•) and the 3-2-1 line (▴) before and after induction of cytokinin synthesis. (D) The relative biosynthetic rate of IAA after induction of cytokinin biosynthesis in line 3-2-1. FW, fresh weight. Error bars display SD.

