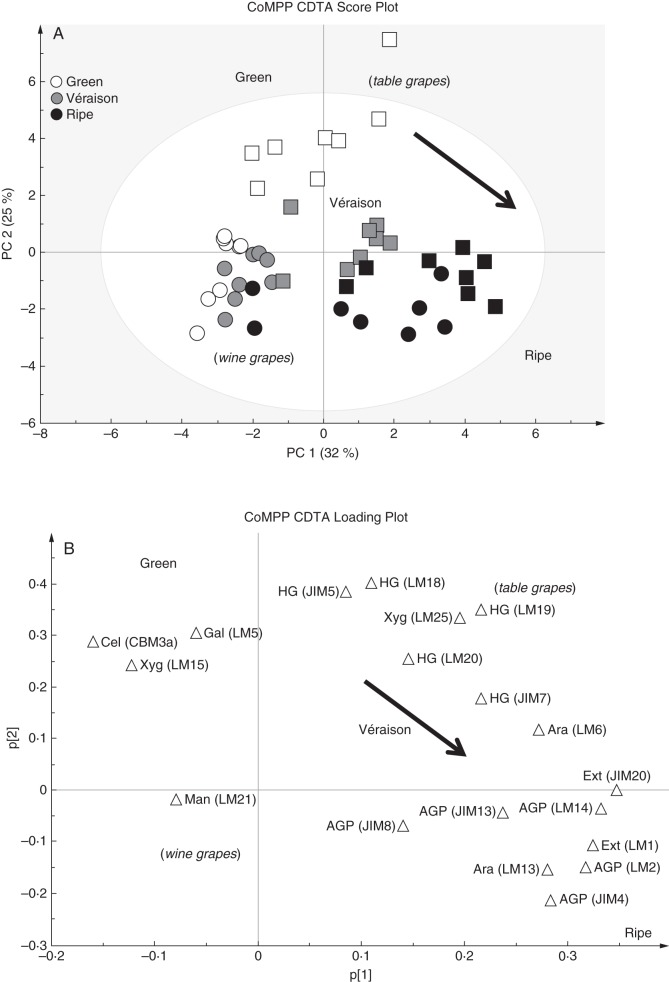
Fig. 4.

CoMPP analysis of CDTA extracts prepared from green, véraison and ripe berries from Cabernet Sauvignon and Crimson Seedless vineyards. (A) PCA score plot coloured according to ripening stage (Cabernet Sauvignon samples are represented as circles and Crimson Seedless samples as squares). (B) Loading plot showing all variables (mAbs and CBMs) contributing to the separation observed. Arrows in (A) and (B) show direction of ripening. (C) Heat map showing averaged values for all probes used for CoMPP; a limit of 100 was set and a cut-off of 5 was imposed (n = 8 from two independent experiments).

