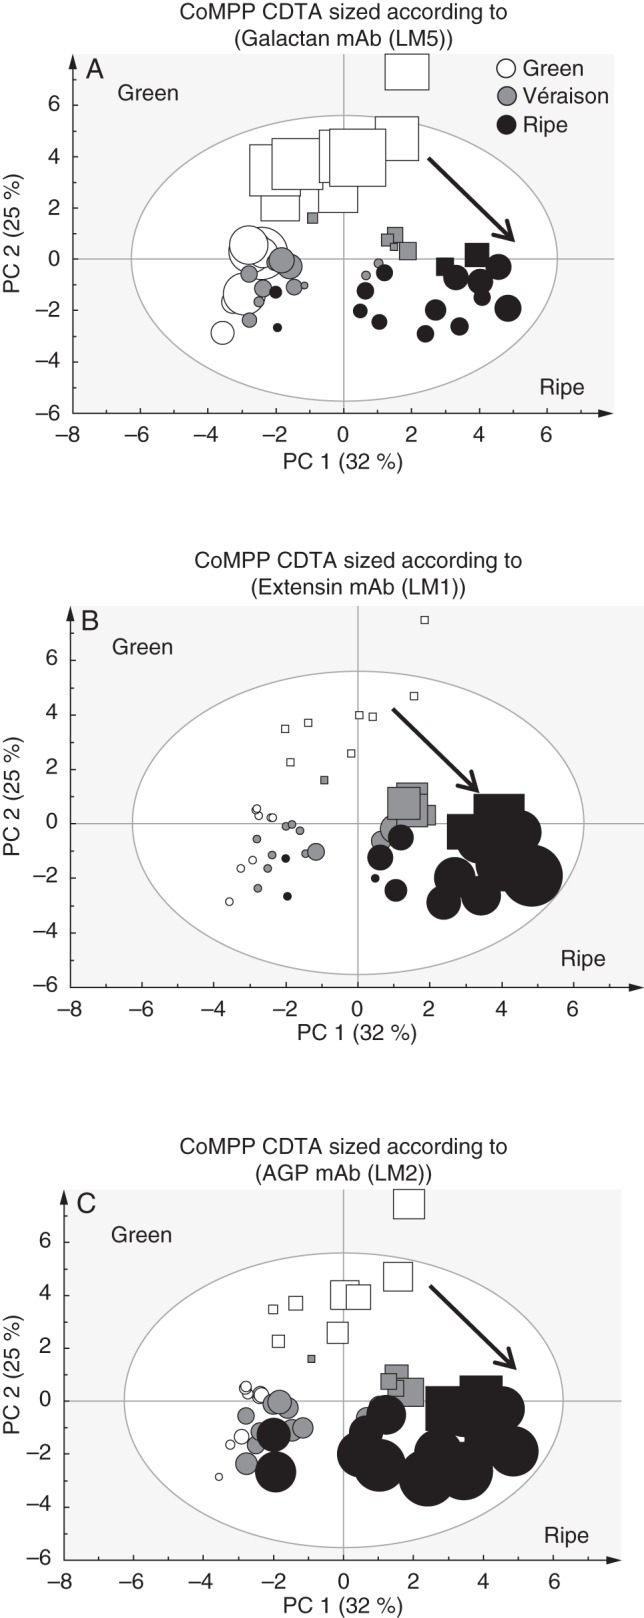
Fig. 5.

Set of three PCA score plots of CoMPP data from CDTA-extracted material. See Fig. 4 for details. Cabernet Sauvignon samples are represented as circles and Crimson Seedless samples as squares. Each plot is sized according to the value of the variable: (A) mAb LM5 for pectic-β(1,4)-galactan;((B) mAb LM1 for extensin; and (C) mAb LM2 for AGP epitopes. Arrows show direction of ripening.
