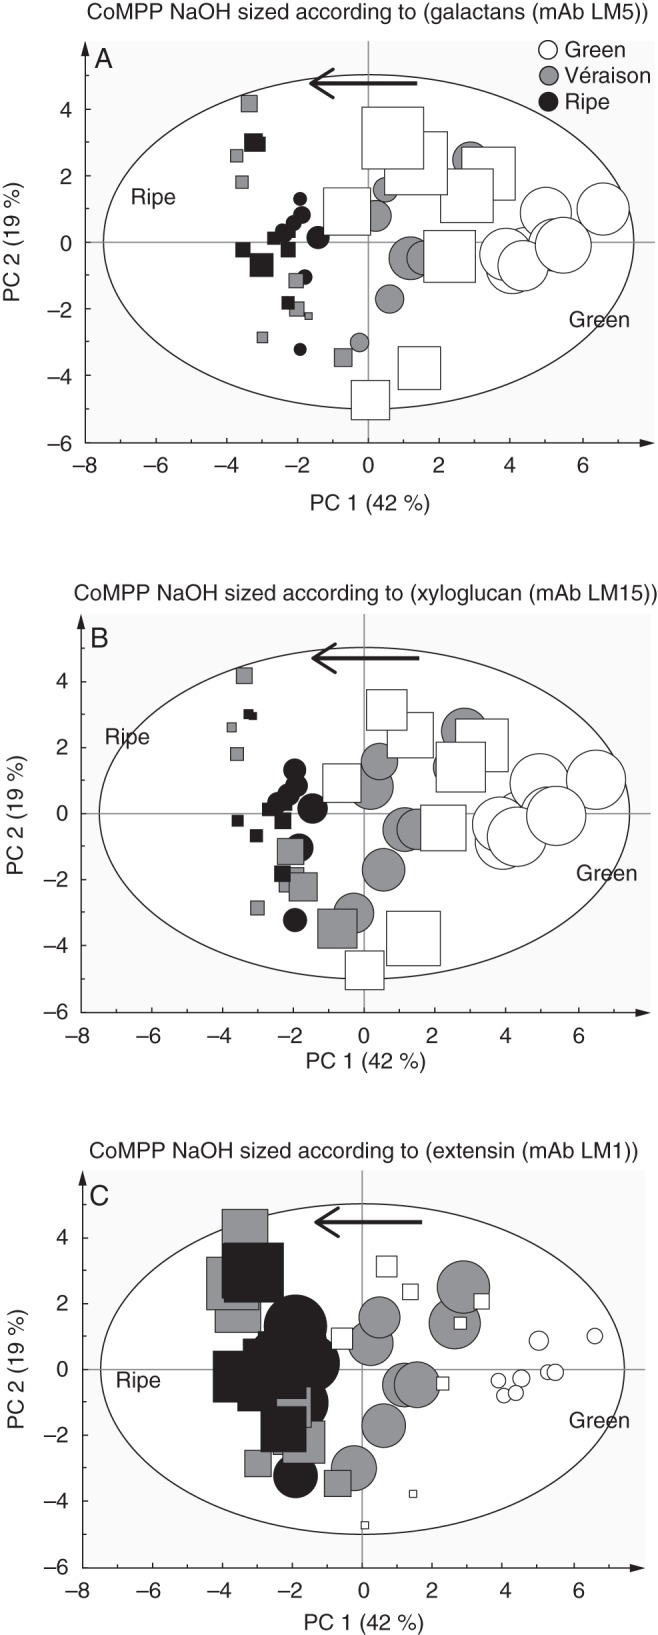
Fig. 7.

A set of three PCA score plots of CoMPP data from NaOH-extracted material as detailed in Fig. 6. Cabernet Sauvignon samples are represented as circles and Crimson Seedless samples as squares. Each plot is sized according to the value of the variable: (A) mAb LM5 for pectic-β(1,4)-galactan;((B) mAb LM15 for xyloglucan; and (C) mAb LM1 for extension epitopes. Arrows show direction of ripening.
