
Fig. 3.
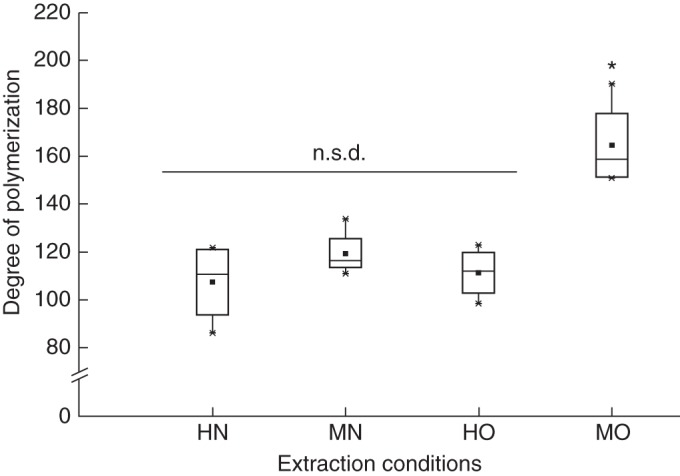
Box plot representation of the degree of polymerization of HG domains isolated from pectin samples extracted at different pH. HN, harsh nitric acid (pH 1·6); MN, mild nitric acid (pH 2·1); HO, harsh oxalic acid (pH 3·5); MO, mild nitric acid (pH 4·6). Average values of two extractions for each peel are denoted by the black squares. *P < 0·05; n.s.d., non-significant difference.