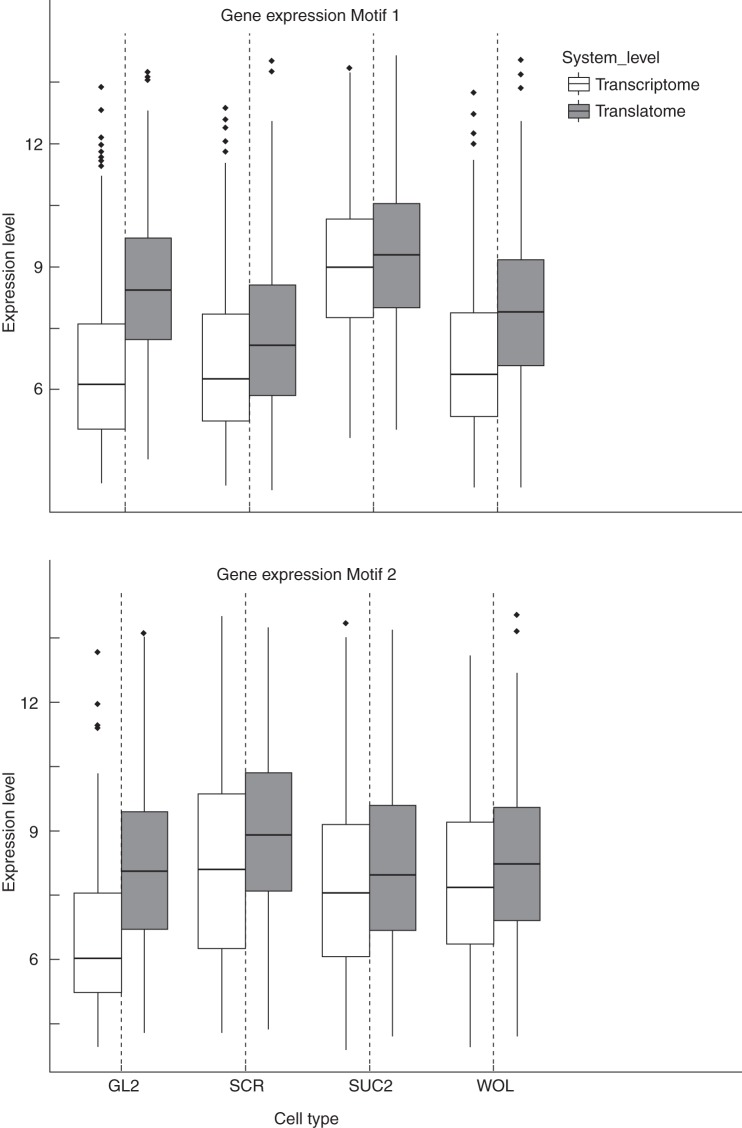
Fig. 10.
Boxplots of expression levels separated by promoters individually for translatome and transcriptome for network motif 1 (upper panel) and motif 2 (lower panel). In motif 1, 279 of 890 DE genes exhibit this characteristic cell-type-specific expression pattern. Furthermore, 214 genes correspond to motif 2.

