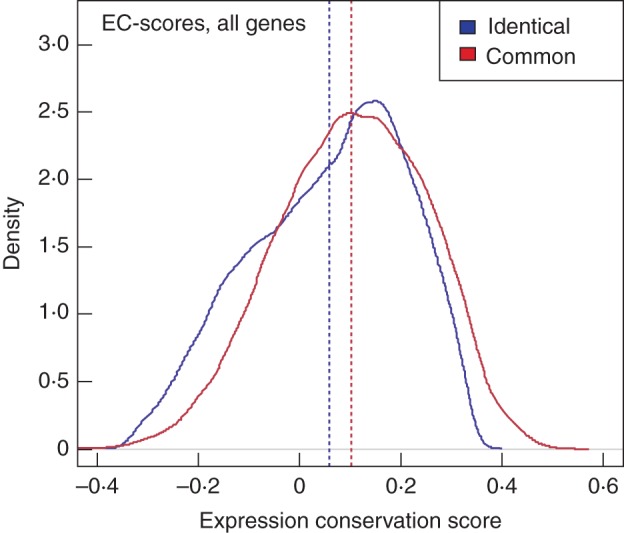
Fig. 5.

Expression conservation (EC) scores of co-expression relationships on the translatome and translatome within the identical (red) and common promoter dataset (blue). The distribution of obtained PCC values for all 22 810 genes is visualized using kernel density estimates. For both the identical and the common dataset, EC score values lie in the interval 0·4–0·5.
