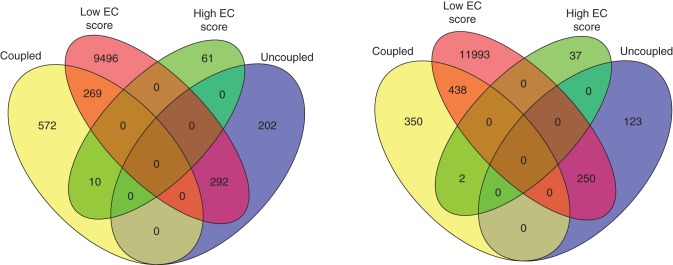
Fig. 7.

Venn diagrams illustrating the overlap of genes displaying conserved expression levels (PCC) and co-expression relationships (EC scores) across root cell types in translatome and transcriptome. Ten genes could be identified using the scenario considering identical promoters (four promoters, left) and two genes considering common promoters (eight promoters, right).
