
Fig. 8.
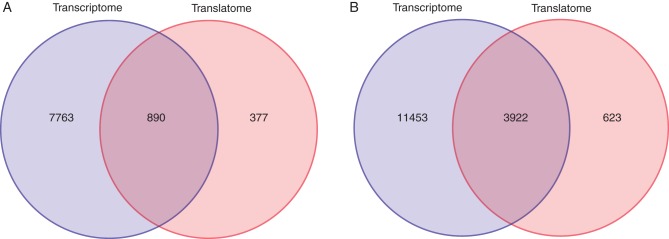
Visualization of the set of differentially expressed (DE) genes across the transcriptome and translatome of the identical (A) and common (B) promoter datasets. Differential expression was assessed by ANOVA at an FDR rate of 5 %. The numbers in the Venn diagram correspond to the number of DE genes found in each system level and the intersection thereof.