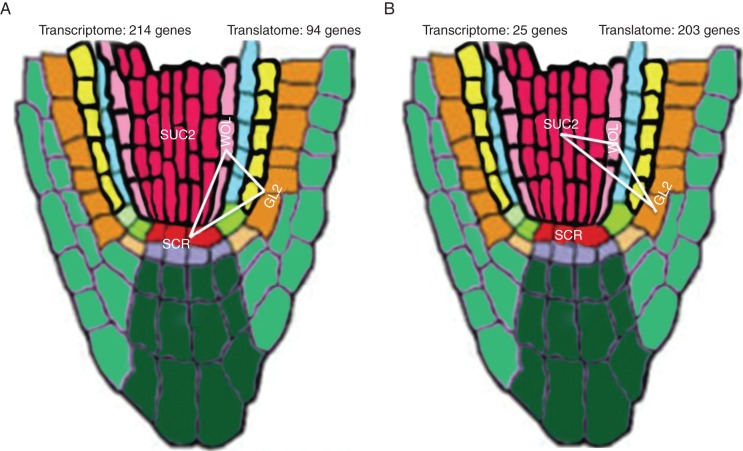
Fig. 9.
Two most commonly occurring network motifs for the transcriptome and translatome. A series of Tukey HSD tests were used on the common DE genes from the identical promoter dataset (890 genes) to detect significant pairwise cell type differences across the transcriptome and translatome. Network motifs were constructed using cell types as nodes and cell type similarity indicated by a red edge. Two network motifs, namely motif 1 and motif 2 in this figure, are represented by 279 and 214 unique genes, respectively.

