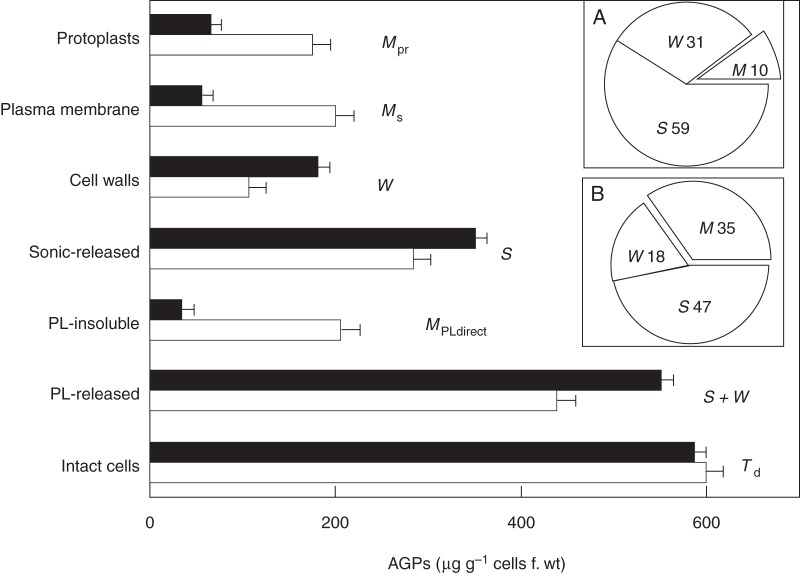
Fig. 1.
Yariv reagent assay of AGP distribution in tobacco BY-2 cells adapted to growth in 2 % NaCl versus non-adapted controls. Solid columns, salt-adapted; empty columns, non-adapted controls. Protoplasts (Mpr), AGPs remaining bound after approx. 2 h treatment with cellulase/pectolyase. Plasma membrane (Ms), PM-bound AGPs calculated from the relation M = Td − ( S + W). Cell walls (W), AGPs assayed in the isolated wall fraction. Sonic-released (S), soluble AGPs released by ultrasonic cell disruption. PL-insoluble, AGPs remaining bound to cells after treatment with pectolyase also reflect PM-bound AGPs, hence MPLdirect. PL-released, soluble AGPs released by pectolyase treatment of intact cells reflect soluble periplasmic AGPs plus AGPs in muro (S + W). Intact cells (Td), AGPs that remain bound to washed cells. Error bars, 1 s.e. Each data point represents a minimum of five separate experiments using 7-d cultures of salt-adapted cells and 7-d cultures for controls. Note similar values for AGPs in protoplasts, plasma membrane and the pectolyase-insoluble residue of non-adapted control cells, but significantly lower values for plasma membrane-associated AGPs in 2 % salt-adapted cells (340 mm NaCl). Insets: Ms, S and W as a percentage of Td: (A) salt-adapted; (B) control cells. [Reprinted from Lamport et al. (2006).]

