
Fig. 4.
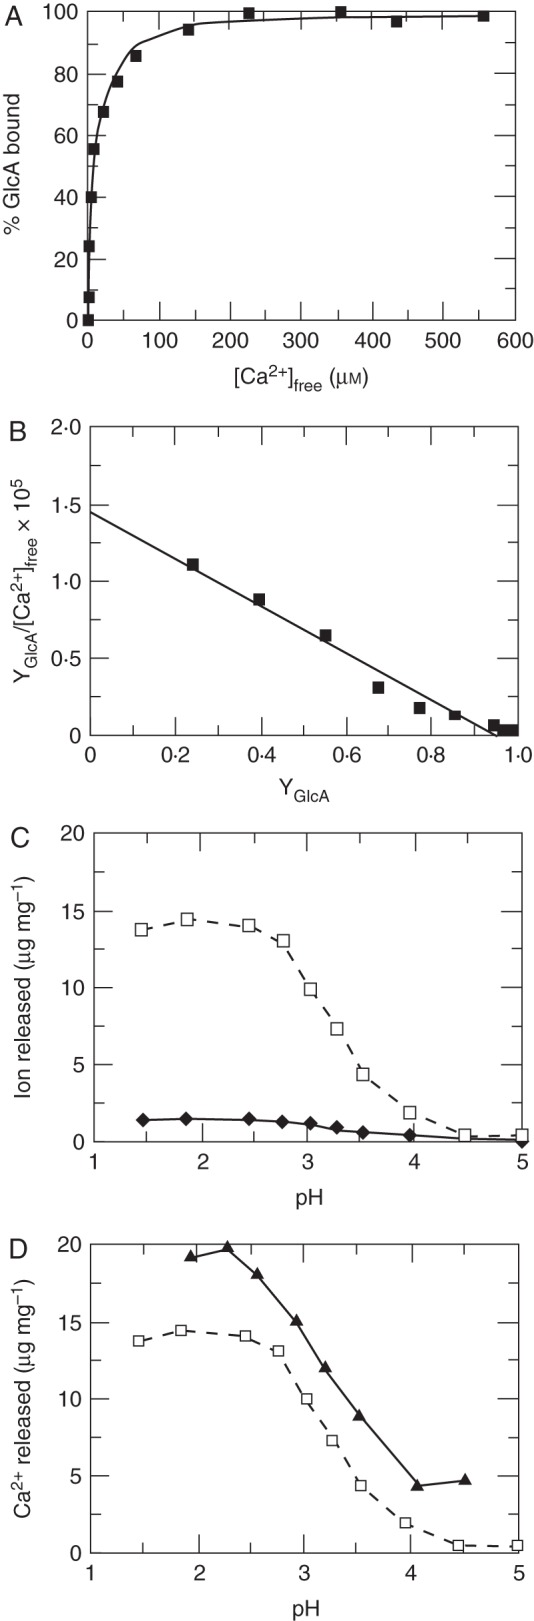
AGP Ca2+ binding: titration of Ca2+-depleted gum arabic with Ca2+ at pH 5. (A) Saturation binding data (black squares) with theoretical curve (line). (B) Scatchard analysis of binding data with best-fit line giving a Kd of 6·5 μm. YGlcA is the fraction of glucuronic acid bound. (C) pH-dependent cation release from Ca2+-saturated gum arabic: Ca2+ (dashed line) and Mg2+ (solid line). (D) Release of Ca2+ from gum arabic (dashed line) compared with pectin (solid line). [Reprinted from Lamport and Varnai (2013).]