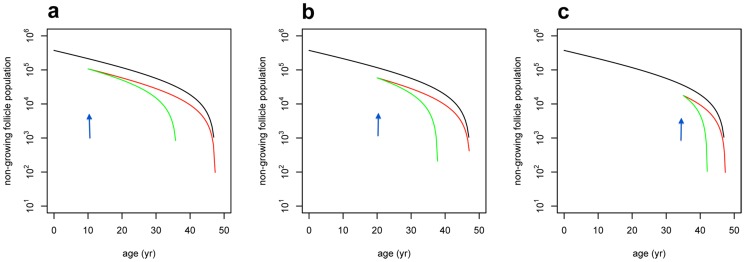
Figure 1. Modelling of decline in ovarian reserve.
a–c. Calculated trajectories of follicle loss after unilateral oophorectomy at ages 10 years (a), 20 years (b), and 35 years (c), assuming the total ovarian follicle pool (green) or alternative model of decline of ovarian reserve (red). Arrows on figures c,d and e indicate time of unilateral oophorectomy at the respective ages.

