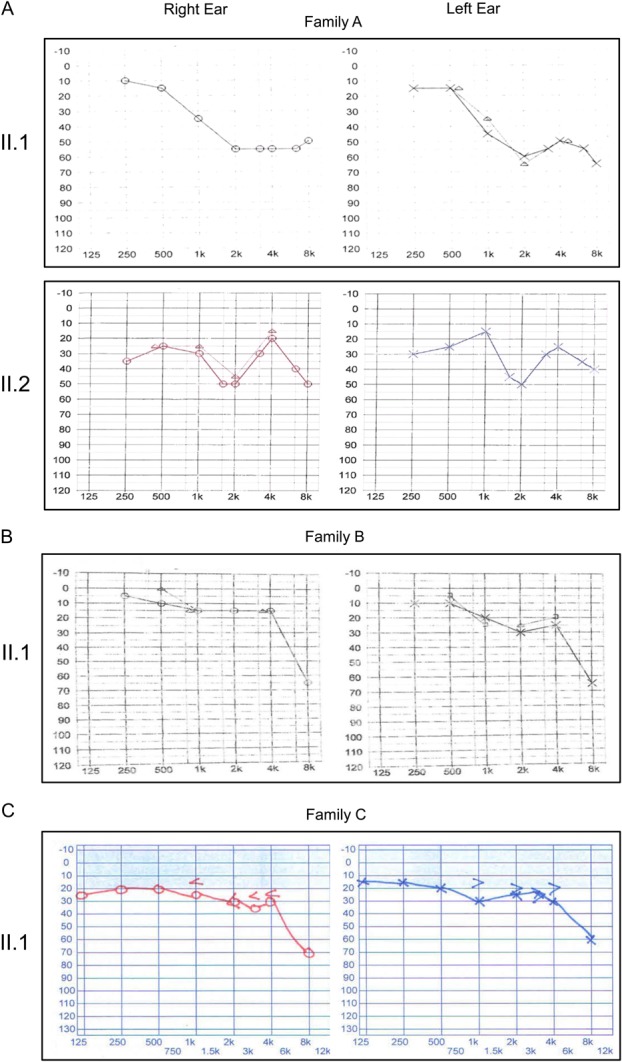
FIGURE 2.

Hearing tests. Audiometry of the CHED2-affected patients from families A, B, and C. The graphs show the frequency in hertz (x axis) and the hearing level in decibels (y axis). The test was performed on the patient at 12 years (family A, II.1), 21 years (family A, II.2), 15 years (family B, II.1), and 12 years (family C, II.1), respectively. Note the reduced sensorineural hearing loss in the range 30 to 50 dB at the higher frequencies.
