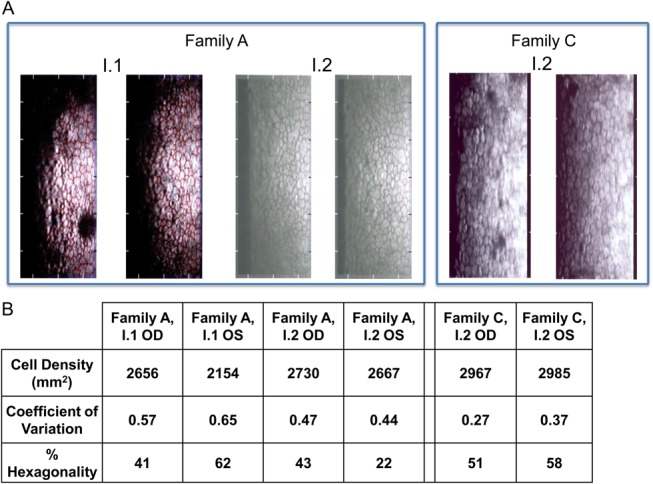
FIGURE 3.

Corneal endothelium analysis. A, Specular microscopy images of the father (I.1) and mother (I.2) of family A and also the mother (I.2) of family C are shown. B, The table highlights the values for cell density (per square millimeter), coefficient of variation, and percentage hexagonality for the specular microscopic images. As a guideline, cell density of 2500 cells per square millimeter at middle age is within the normal range, and this value decreases with age, a coefficient of variation >0.4 and <50% hexagonality are indicative of an abnormal endothelium.
