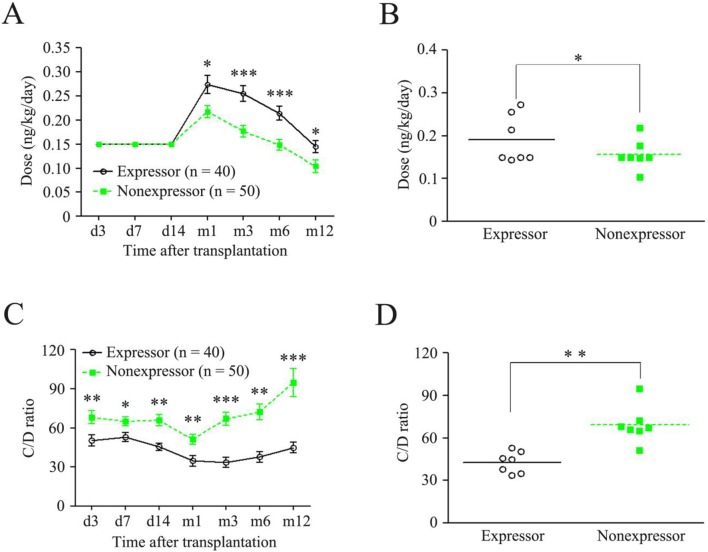
Figure 1. Doses and C/D ratios of TAC compared between recipients with CYP3A5 expressor and those with nonexpressor.
(A) Dose-time curves; (B) Doses in dots, every dot represents a dose at a time point; (C) C/D ratio-time curves; (D) C/D ratios in dots, every dot represents a C/D ratio at a time point. TAC, tacrolimus; Expressor, CYP3A5 *1/*1 and *1/*3; Nonexpressor, CYP3A5 *3/*3; *p<0.05; **p<0.01; ***p<0.001.

