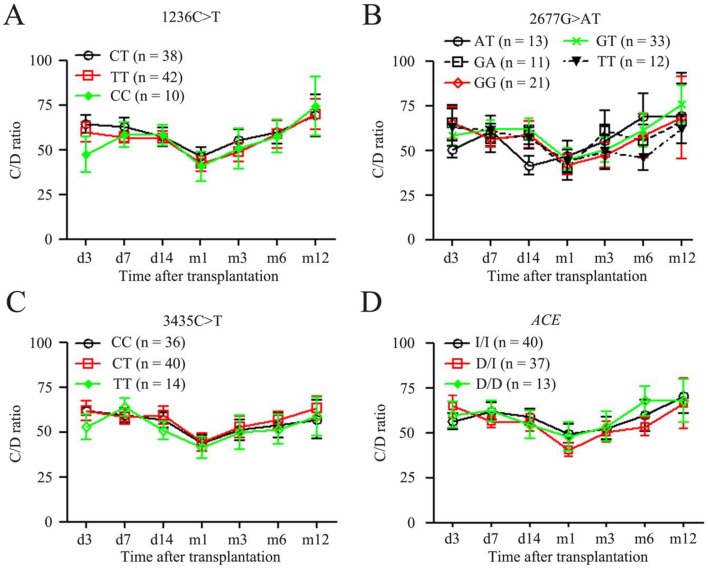
Figure 3. C/D ratios of TAC compared among ABCB1 genotypes and among ACE genotypes.
(A) C/D ratio-time curves of ABCB1 variants at 1236C>T; (B) C/D ratio-time curves of ABCB1 variants at 2677G>AT; (C) C/D ratio-time curves of ABCB1 variants at 3435C>T; (D) C/D ratio-time curves of ACE variants. TAC, tacrolimus.

