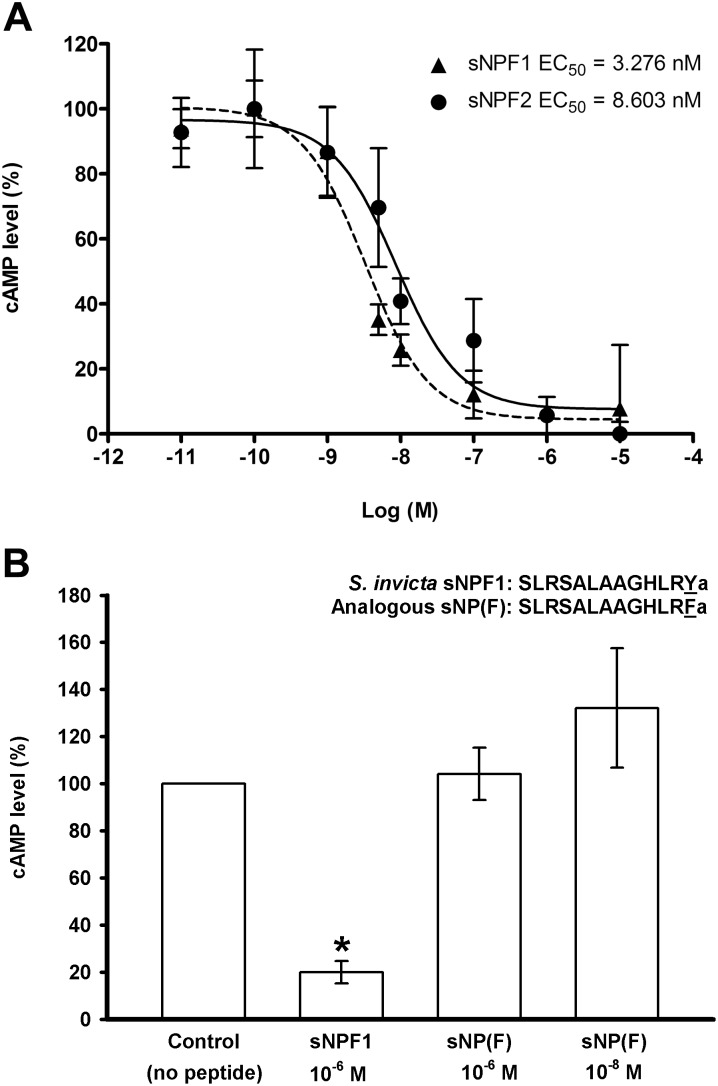
Figure 7. sNPF peptides inhibition of forskolin-stimulated cAMP accumulation in CHO-K1 cells stably transformed with the S. invicta sNPF receptor (SisNPFR-C6E8).
A. Independent dosage-response curves of S. invicta sNPF1 [SLRSALAAGHLRYa (13 a.a. residues); dashed line] and sNPF2 [SALAAGHLRYa (ten a.a. residues); solid line]. Cells were treated with a phosphodiesterase inhibitor previous to the simultaneous application of peptide and forskolin (10 µM), which was applied to elicit maximal cAMP production. The Y-axis represents the cAMP production as a percentage of the forskolin-stimulated maximum cAMP level, considered 100%. The X-axis shows the log molar (Log (M)) concentrations of peptides applied. Values indicate means ± S.E. of three independent biological replicates Half maximal effective concentration values (EC50 values) are given on the graph. B. In the fire ant sNPF1 sequence, the change of the C-terminal amidated residue ‘Y’ to ‘F’ [sNP(F)] eliminates the ligand activity on the receptor. S. invicta sNPF1 (1 µM) decreased cAMP as expected (*, significantly different at p≤0.05 level). Data were analyzed by ANOVA followed by Tukey’s multiple comparison test. Each value is the average of three biological replicates with the error bars showing standard deviation of the average for each treatment. The standard error of the analysis is 19.8.

