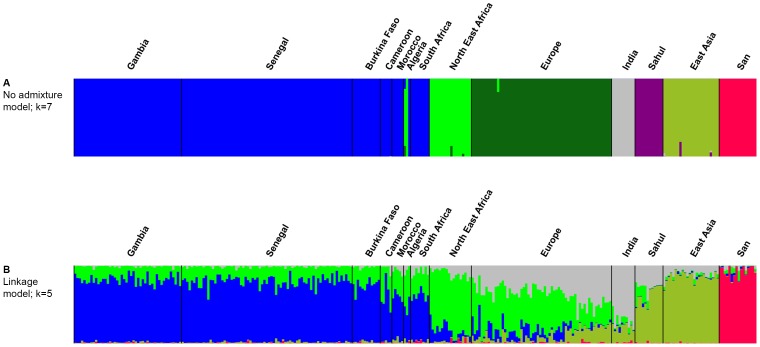
Figure 3. STRUCTURE analysis of 46 Gambian strains in relation to a representative sample of the global diversity in H. pylori.
Gambian H. pylori were compared with strains from other previously assigned populations using no-admixture model (3A) and the linkage model (3B). Population are colour coded according to Figure 2. Each line represents an isolate and colours indicate its inferred modern (3A) or ancestral population(s) (3B).

