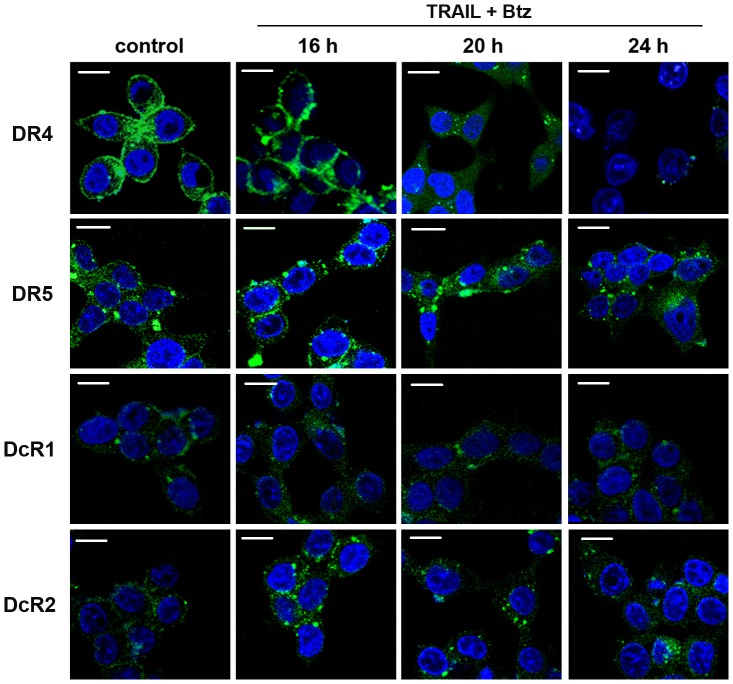
Figure 5. Confocal microscopic analysis of death and decoy receptors localization in HCT116 p53−/− cells treated with TRAIL and bortezomib for indicated periods. Scale bar = 10 µm.
Cells were grown for different periods in the presence of indicated reagents, washed with PBS, fixed in 3% paraformaldehyde for 30 min, permeabilized with 0.1% Triton X-100 in PBS for 10 min and blocked in 3% BSA for 30 min. FITC-conjugated antibodies to DR4, DR5, DcR1 and DcR2 receptors (Abnova) were added at dilution 1∶100 and cells were incubated for 1 h in the presence of Hoerst 33342 for visualization of cell nuclei. Then non-specific bound antibodies were washed with blocking buffer containing 0.1% of Triton X-100. Cells were visualized in 0.6- µm sections using an inverted Nikon Eclipse TE2000-E laser scanning confocal microscope under a ×60 oil immersion objective.

