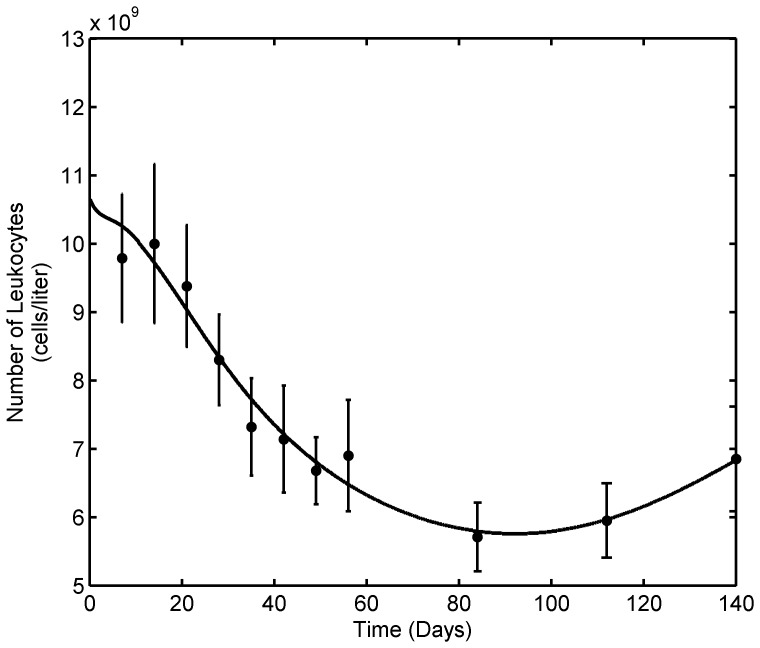
Figure 5. Leukopoiesis model fit to average patient data.
Solid dots represent average patient data and curve represent leukocyte model (Eqn. 4) fit. The model mimics the clinical observation during 6-MP treatment; Depletion of leukocytes following 6-MP dosing has been countered by the body's feed-back mechanism. Error bars represent standard error.

