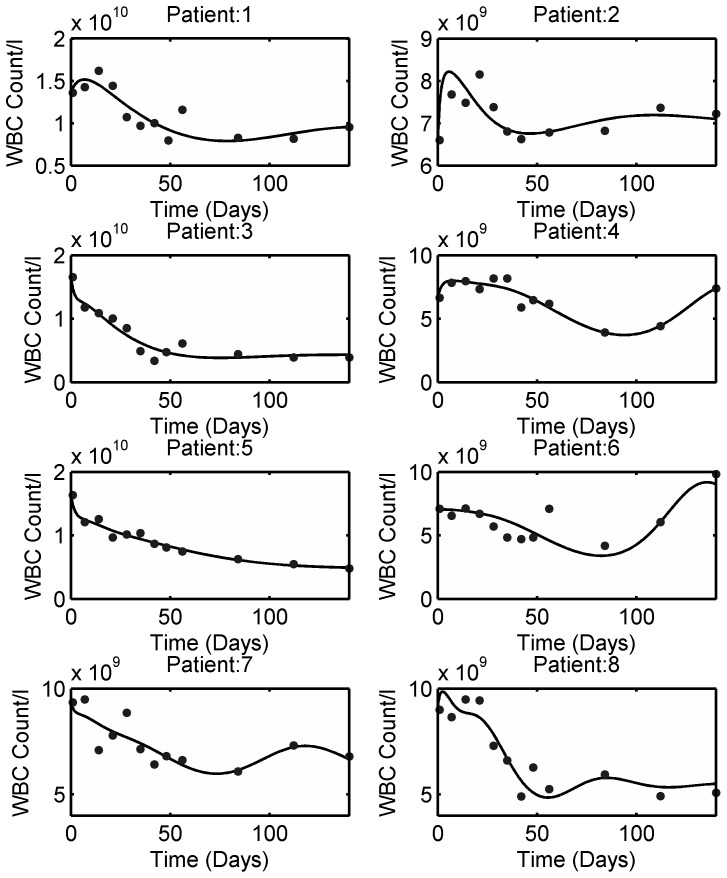
Figure 8. Leukopoiesis model fit to individual patient data obtained from literature.
Solid dots indicate the individual patient WBC count and solid lines represent the model fit. The estimated patient-specific parameters are provided in Table 5. The model mimics diverse behavior observed during 6-MP treatment.

