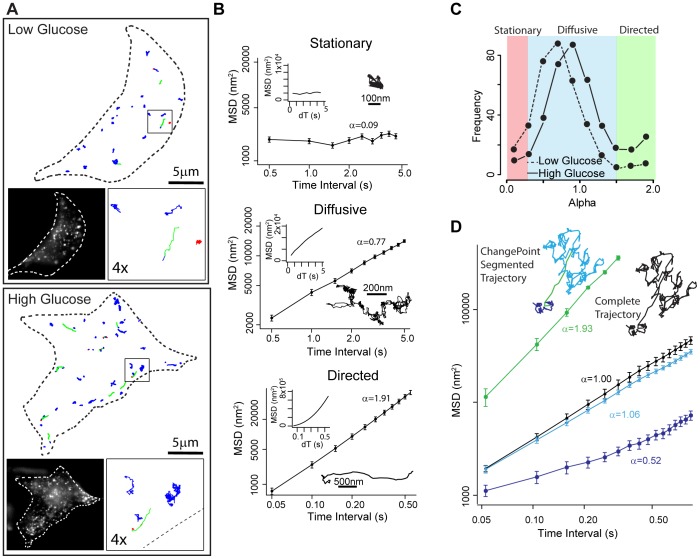
Figure 1. Modes of motion of GFP-labeled insulin granules.
(A) Outline of representative INS-1 cells with insulin granule trajectories overlaid in low (upper panel) and high (lower panel) glucose conditions. Left inset: image of INS-1 cell with eGFP-labeled insulin granules. Right inset: 4× magnification of trajectories in the black box. Trajectories are color-coded to depict mode of granule motion. Red indicates stationary granule, blue indicates diffusive-like motion, and green indicates directed motion. (B) Insulin granules display 3 distinct modes of motion: stationary, diffusive-like and directed. Example trajectories for each mode of motion and MSD plots on log-log axes (large graphs) and linear axes (inset; dT equals time interval) are shown. Diffusive exponent, α, which is the slope of the log-log MSD indicated. (C) Frequency distribution of α values in low (dashed line: 383 granules in 14 cells) and high (solid line: 457 granules in 15 cells) glucose conditions. α<0.25 characterizes granules as stationary (red shaded area), 0.25≤α≤1.5 as undergoing random motion (diffusive-like, blue shaded area) and α>1.5 as undergoing directed motion (green shaded area). (D) Log-log MSD plots and trajectory of a granule that switches modes of motion during a trajectory. When MSD analysis is performed on the entire trajectory, α = 1 (black line, black trajectory). After analysis using the ChangePoint algorithm, 3 periods of motion are identified: diffusive-like (α = 0.53, dark blue line), directed (α = 1.93, green line) and diffusive-like (α = 1.06, light blue line). Error bars indicate standard error.

