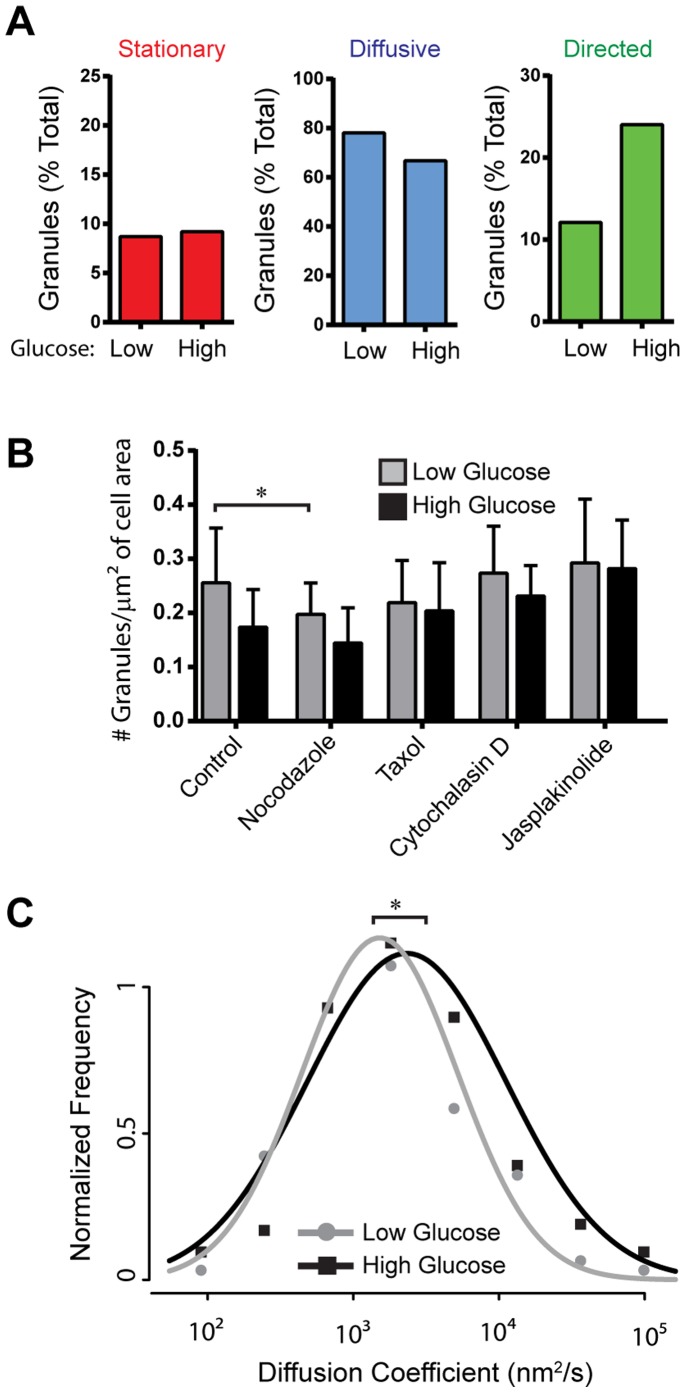
Figure 2. Effect of glucose stimulation on insulin granule motion.
(A) Bar charts depict the percentage of granules that exhibit stationary, diffusive-like, and directed motions in low and high glucose conditions. 14 cells/383 granules in low glucose and 15 cells/457 granules in high glucose conditions were analyzed. (B) Effect of glucose stimulation on granule number at the subplasmalemmal space within the TIRF field. Glucose stimulation causes a significant decrease in granule number at the cell surface in control and drug treated cells as determined using a two-way ANOVA F(1, 148) = 8.81, p = 0.0035. In low glucose conditions nocodazole treatment results in a significant decrease in number of granules at the cell surface (p<0.05). Error bars indicate standard deviation. Number of cells analyzed in low and high glucose conditions, respectively, are as follows: control 15/16; nocodazole 21/24; taxol 19/20; cytochalasin D 13/15; jasplakinolide 6/7. (C) Normalized diffusion coefficient frequency distributions show that high glucose stimulation significantly increases of granule diffusion coefficients compared to basal, low glucose conditions (p<0.01).

