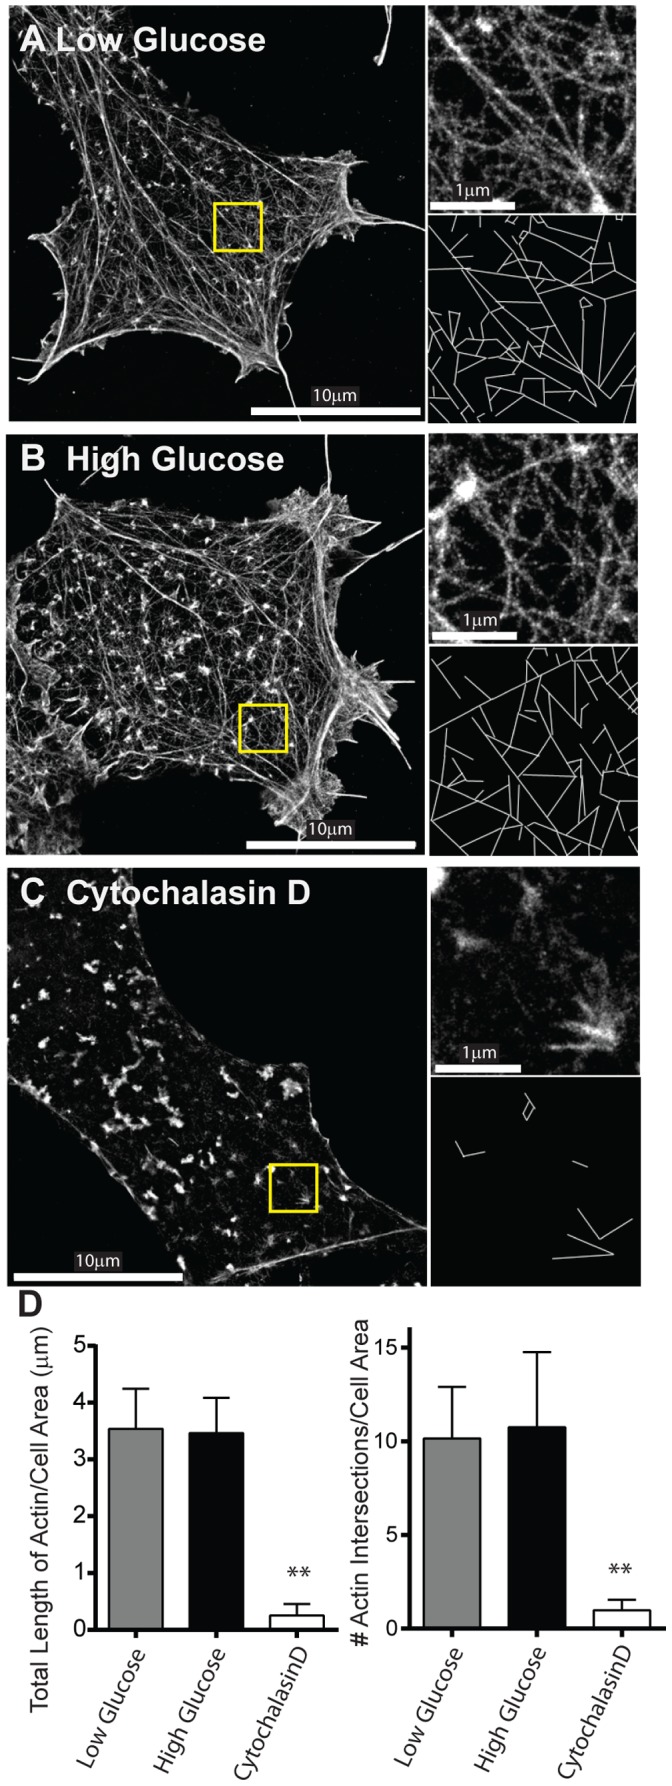
Figure 5. Effect of glucose stimulation on actin filament organization.

Super-resolution STORM images of the actin cytoskeleton in INS-1 cells in low (A) and high (B) glucose conditions and after actin depolymerization with cytochalasin D (C). In each STORM image (A–C) yellow highlighted area is magnified 3x in the upper right image with skeletonized image below used for quantification of actin filament length and number of actin filament intersections in D. (D) Quantification of actin organization. Left: The length of actin per µm2 of imaged cell area under various conditions. Right: The number of actin intersections per µm2 of imaged cell area under various conditions. ** indicates p<0.001. Values are mean±SEM.
