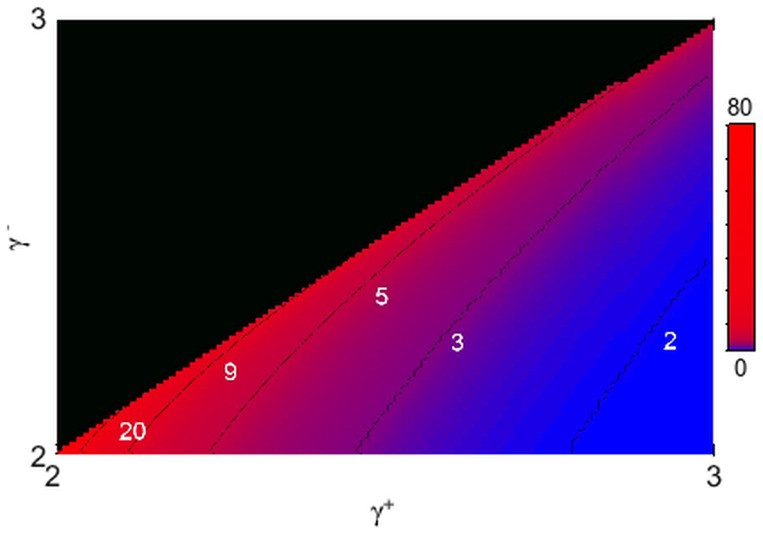
Figure 1. Effective upper cutoff on the in-degrees if they are conditioned on the sum of the out-degrees.
The contour plot shows the logarithm of the introduced upper cutoff. Note that for almost all the choices of power-law exponents, such cutoff is so low that the greatest part of the distribution tail is lost, affecting the scale-free character of the resulting network. The labels indicate the logarithm of the cutoff for the corresponding contour lines. Only half of the region is plotted, as we are under the assumption that  .
.

