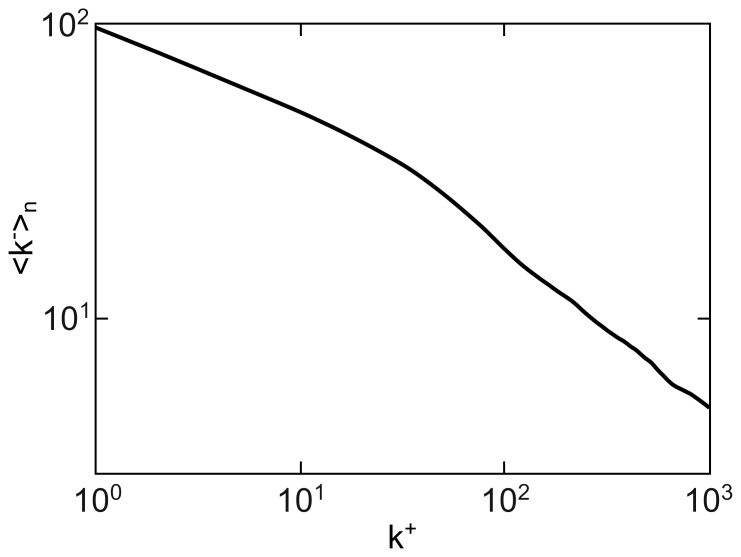
Figure 4. Disassortative degree correlations.
The plot shows the average in-degree  of the neighbours of nodes with a given out-degree
  + for an ensemble of networks with
  and N = 1000. The dependence of
  on
on  + clearly indicates that nodes with low out-degree link preferentially to nodes of high in-degree, and nodes with high out-degree link mostly to nodes of low in-degree. The monotonically decreasing dependence confirms the strong disassortative nature of the networks.

