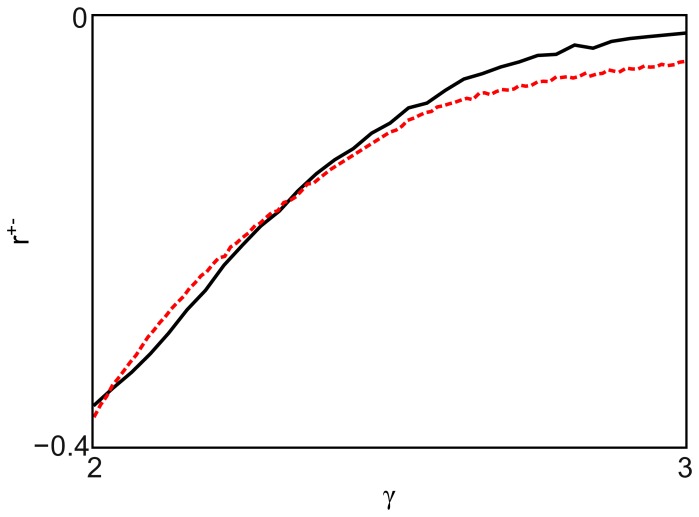
Figure 5. Entropy-maximizing disassortativity.
The plot shows the out-in correlation coefficients for directed scale-free networks with  . The simulation data are shown in solid black. The red dotted line corresponds to the coefficients that maximize the information entropy for a given
  . The good agreement of the results indicates the entropic origin of the disassortativity observed in directed scale-free networks.

