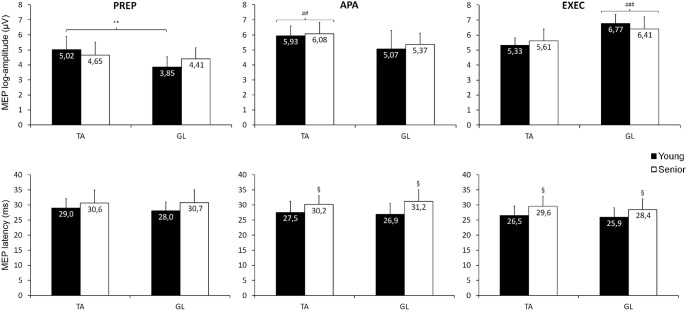
Figure 4. Mean MEP log-amplitude (upper panel) and latency (lower panel) computed in TA and GL in the two groups at each time delay/phase of the heel raising task.
Symbols indicated significant main effects or interactions. Note that in the PREP phase, a significant group×muscle interaction (indicated by **, p<0.01) was found reflecting the difference in MEP amplitude between TA and GL. In the APA and EXEC phases, a significant main effect of muscle (indicated by ## and ###, p<0.01 and p<0.001 respectively) was found reflecting larger MEP amplitude in the TA and in the GL during their respective phase. A main effect of group (indicated by §, p<0.05) was found for MEP latency reflecting delayed latency in seniors in the APA and EXEC phases. Abbreviations as in Figures 1, 2 and 3.

