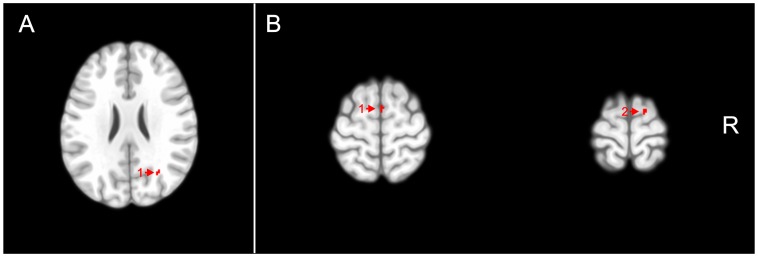
Figure 1. Voxel clusters of relatively reduced gray matter (A) and increased gray matter (B) in attention-deficit/hyperactivity disorder subjects compared to healthy controls are shown in red, overlaid on transaxial sections from a reference brain spatially normalized to the Montreal Neurological Institute stereotactic space, in neurological convention.
Statistical maps are displayed with a statistical threshold of p<0.001, uncorrected for multiple comparisons. A)1) Angular gyrus (Right); B)1) Supplementary motor area (right); B)2) Superior frontal gyrus (right). R: Right.

