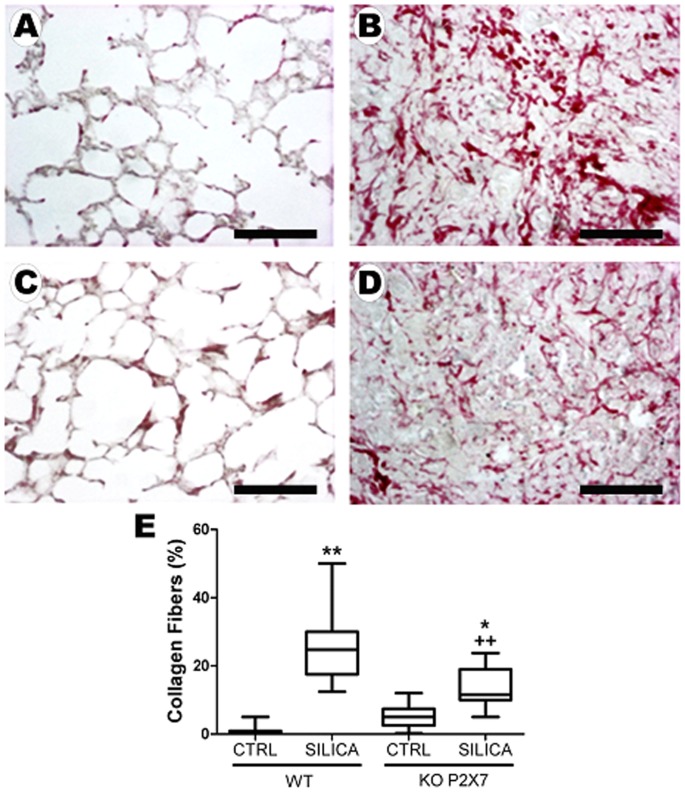
Figure 3. Collagen fiber quantification in lung parenchyma after silica instillation.
Photomicrographs of lung parenchyma (PicroSirius) of wild-type (A, B) and P2X7 receptor knockout (C, D) 14 days after intratracheal instillation of silica particles (B, D) or saline (A, C). E: quantification of collagen fibers in lung parenchyma of wild-type (WT) and P2X7 receptor knockout (KO) mice. Box plots show median values of 5–7 animals in each group with statistical cut off of ±10–90%, with respective SD (15 random non-coincident fields/animal), and are expressed as % surface density of fibers per tissue area in each field. Bars: 900 µm; *p <0.05 and **p<0.01 in relation to the respective control; ++p <0.05 in relation to Silica-WT.

