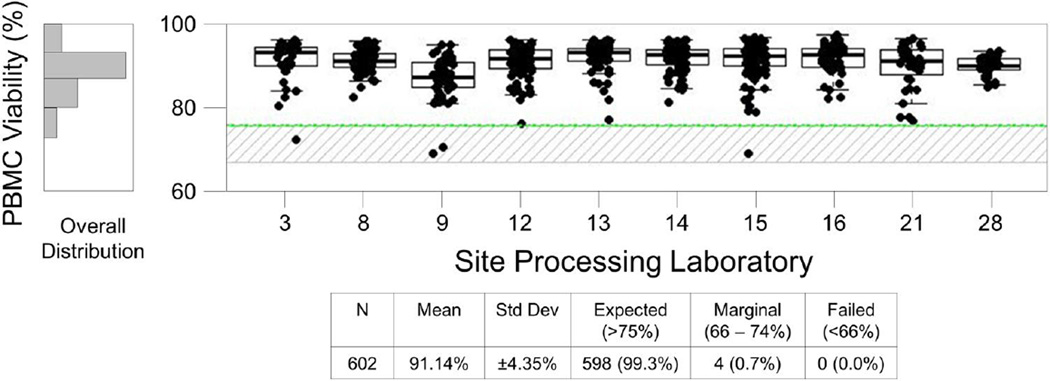
Figure 8. AQC Day 2 Viability Report for protocol HVTN 205.
This report includes specimens processed September 2012 through August 2013. Only sites that processed for this protocol are shown. PBMC samples were thawed for immunologic assays and Day 2 viability was assessed following overnight incubation at 37°C and 5% CO2. Boxes represent the 25 and 75 percentile, whiskers extend to the most extreme data point within 1.5 interquartile ranges (IQR) and the horizontal line in the box indicates the median viability for the site for the specified period. The upper line indicates the preferred minimum viability, the lower line indicates the minimum viability for acceptance in a functional assay, and the shaded area is considered acceptable but marginal.

