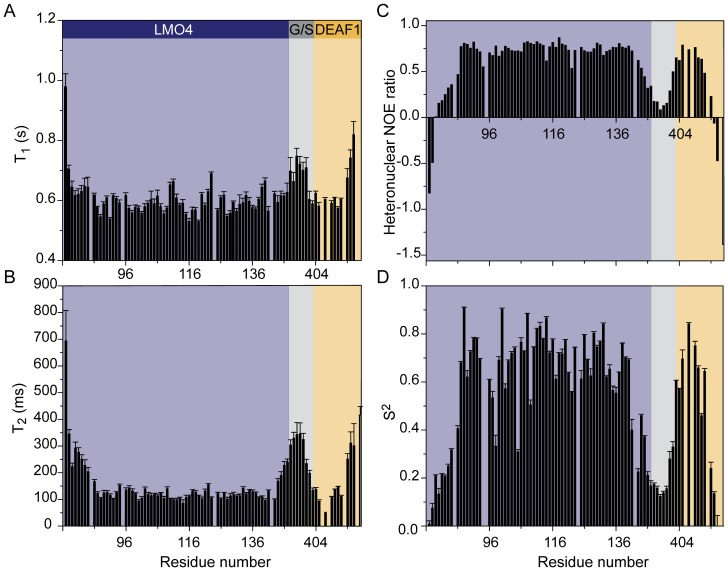
Figure 5. Relaxation analysis of LMO4LIM2•DEAF1404–418.
(A) Longitudinal (T 1), (B) transverse (T 2) relaxation time constants, (C) heteronuclear NOEs, calculated as the ratio of peak intensities with and without proton saturation, all at 600 MHz. (D) Lipari-Szabo (S2) parameters for each assigned backbone amide group in LMO4LIM2•DEAF1404–418 calculated from data recorded at 600 MHz and 800 MHz, using the program relax. Error bars represent one standard deviation from the curve fit for each residue. Background colours indicate regions belonging to LMO4 (blue), DEAF1 (yellow) or the glycine-serine linker (G/S; grey).

