
Table 2.
Impairment of 14C-L-IMH uptake by selected ligands and their binding by Mhp1
| Compound | Structure | Residual uptake (%) | Apparent IC50 (μM) | Apparent Kd (μM) |
|---|---|---|---|---|
| D-NMH | 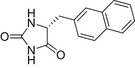 |
11.4 ± 0.9 | 17.1 ± 1.1 | 1.8 ± 0.3 |
| L-NMH | 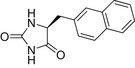 |
12.3 ± 0.8 | 14.9 ± 1.1 | 3.6 ± 0.8 |
| BVH | 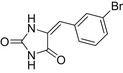 |
18.0 ± 0.7 | 38.8 ± 1.1 | 2.0 ± 0.2 |
| L-IMH | 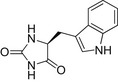 |
24.7 ± 1.3 | 119.2 ± 1.1 | 19.0 ± 2.0 |
| D-IMH | 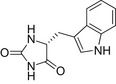 |
39.9 ± 1.5 | ND | 20.6 ± 3.8 |
| L-BH | 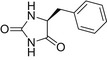 |
59.9 ± 1.7 | 945.0 ± 1.1 | 36.0 ± 1.4 |
| D-BH | 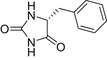 |
70.9 ± 4.1 | ND | 130.0 ± 10.0 |
| Hydantoin |  |
87.4 ± 2.8 | ND | NC |
| L-Tryptophan |  |
100.3 ± 2.2 | ND | ND |
| D/L-Allantoin | 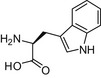 |
101.9 ± 2.3 | ND | NC |
Percentage uptake and apparent IC50 values were determined by a 14C-L-IMH ligand uptake assay, and apparent Kd values were determined by stopped-flow spectrophotofluorimetry. All measurements were taken in the presence of 150 mM NaCl (see Materials and Methods and Supplementary Methods) and are shown with the associated standard errors of the mean. NC denotes “not converged” indicating that an apparent Kd or IC50 value could not be determined by fitting to a rectangular hyperbola. ND denotes “not determined”.