
Figure 3. Reduced numbers of peripheral NK cells in Dok1-/Dok2-deficient mice.
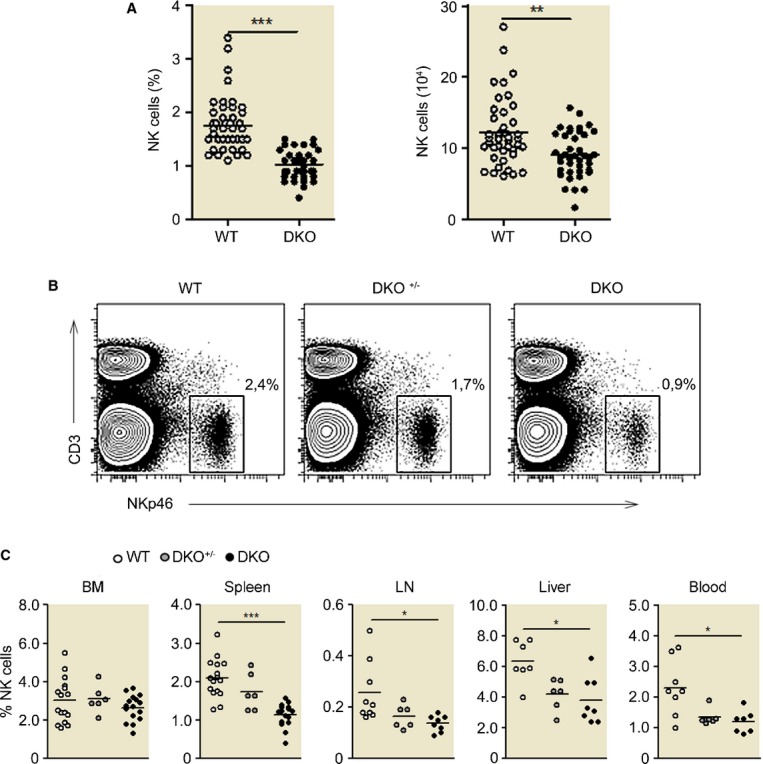
Analysis by flow cytometry of lymphocyte populations isolated from various organs of Dok1-/Dok2-deficient (DKO), wild-type (WT), and heterozygous (WT × DKO = DKO+/−) 129/Sv mice and stained for CD3 and NKp46.
- A Percentage and absolute numbers of CD3− NKp46+ NK cells in spleen from WT and DKO 129/Sv mice. Each plot represents the data obtained from 1 mouse. ***P < 0.0001; **P < 0.01.
- B, C The percentage of CD3− NKp46+ NK cells resident in different organs has been analyzed from the three types of mice (WT, DKO+/−,and DKO). (B) Gating is shown for the spleen. (C) Histograms corresponding to the NK-cell frequency for the indicated organs ± SD (n = 9–20 mice, depending on the organ).