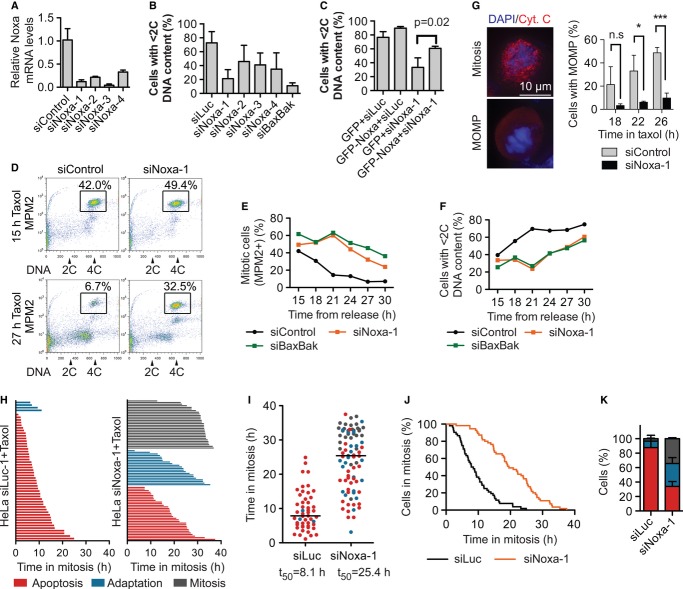
Quantification of Noxa mRNA levels by quantitative PCR in HeLa cells transfected with the indicated siRNAs for 48 h. The means and standard deviations of triplicate samples are shown.
HeLa cells were transfected with the indicated siRNAs for 48 h, treated with taxol for 24 h, stained with PI, and subjected to FACS. The percentage of cells with < 2C DNA content (apoptotic cells) was plotted as the mean and standard deviation of triplicate experiments.
HeLa cells were transfected with the indicated siRNAs and plasmids, treated with taxol for 15 h, and subjected to FACS. The percentage of cells with < 2C DNA content (apoptotic cells) was plotted. Average and standard deviations of three experiments are shown.
HeLa cells transfected with siControl or siNoxa-1 were synchronized by double thymidine block and released into medium with taxol. Samples were taken at different time points after thymidine release and processed for FACS. FACS graphs at indicated times are shown. Mitotic cells (MPM2-positive 4C cells) are boxed and quantified.
Quantification of the percentage of mitotic cells during the time course in (D).
Quantification of the percentage of apoptotic cells (cells with < 2C DNA content) during the time course.
HeLa cells transfected with siControl or siNoxa-1 were synchronized by thymidine block and then released into taxol, fixed at the indicated times, and stained with anti-cytochrome c and DAPI. Left panel, representative images of a mitotic cell (with cytochrome c in the mitochondria) and a cell that had undergone MOMP (with diffuse cytochrome c staining). Right panel, the percentage of cells with MOMP plotted against time after thymidine release. Average and standard deviations of triplicate experiments plotted. P-values calculated by Student's t-test are: n.s. (not significant), *P = 0.02, ***P = 0.0005.
Representative samples from live-cell imaging of HeLa cells transfected with siLuc or siNoxa-1 and treated with taxol. Waterfall plots, each bar represents an individual cell.
Dot plot of the phenotype and mitotic duration of each cell in (H). Cells with different fates are colored as in (H). The bar indicates the median (t50).
Mitotic duration curves of cells in (H). The cumulative percentage of mitotic HeLa cells was plotted against their mitotic durations. Δt50(siNoxa-1–siLuc) = 11.1 ± 4.9 h, n = 4.
Quantification of the terminal phenotypes of the mitotic cells in (H). Color scheme is the same as in (H). The means and standard deviations of two independent experiments are shown.

