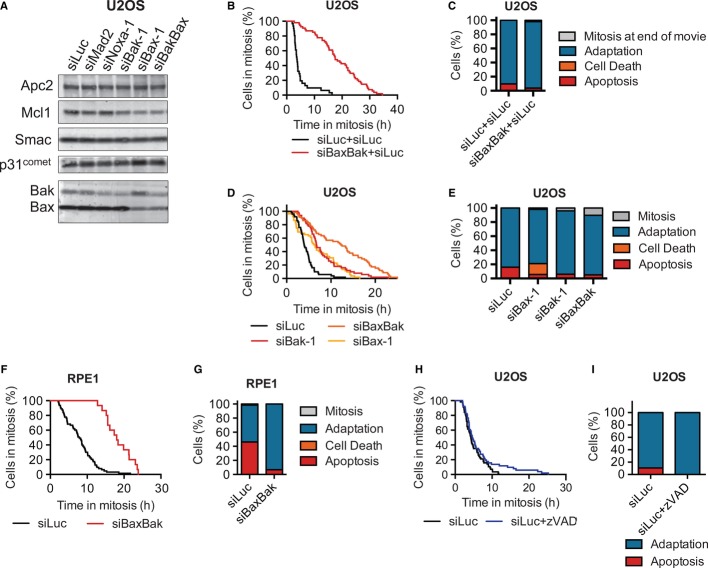
Western blot of lysates from asynchronous U2OS cultures transfected with the indicated siRNAs for 48 h and blotted with the indicated antibodies.
Live-cell imaging analysis of U2OS cells transfected with the indicated siRNAs for 48 h and then treated with taxol. Cumulative percentage of mitotic cells was plotted against their mitotic durations. Δt50(siBaxBak–siLuc) = 10.1 ± 3.5 h, n = 6.
Quantification of the terminal phenotypes of the mitotic cells in (B). Bax/Bak-deficient cells that die in mitosis without membrane blebbing are simply categorized as cell death, as opposed to apoptosis.
Cumulative percentage of mitotic U2OS cells was plotted against their mitotic durations. t50(siBaxBak) = 12.2 h, t50(siBax-1) = 6.2 h, t50(siBak-1) = 6.7 h, t50(siLuc) = 3.9 h.
Quantification of the terminal phenotypes in (D).
Live-cell imaging analysis of RPE1 cells transfected with the indicated siRNAs for 48 h and then treated with taxol. Cumulative percentage of mitotic cells was plotted against their mitotic durations. Δt50(siBaxBak–siLuc) = 11.3 ± 3.4 h, n = 3.
Quantification of the terminal phenotypes of the mitotic cells in (F).
Live-cell imaging analysis of U2OS cells transfected with siLuc and treated with 50 μM z-VAD-fmk and taxol. Cumulative percentage of mitotic cells was plotted against their mitotic durations. t50(siLuc) = 4.2 h, t50(siLuc + z-VAD-fmk) = 4.6 h.
Quantification of the terminal phenotypes in (H).

