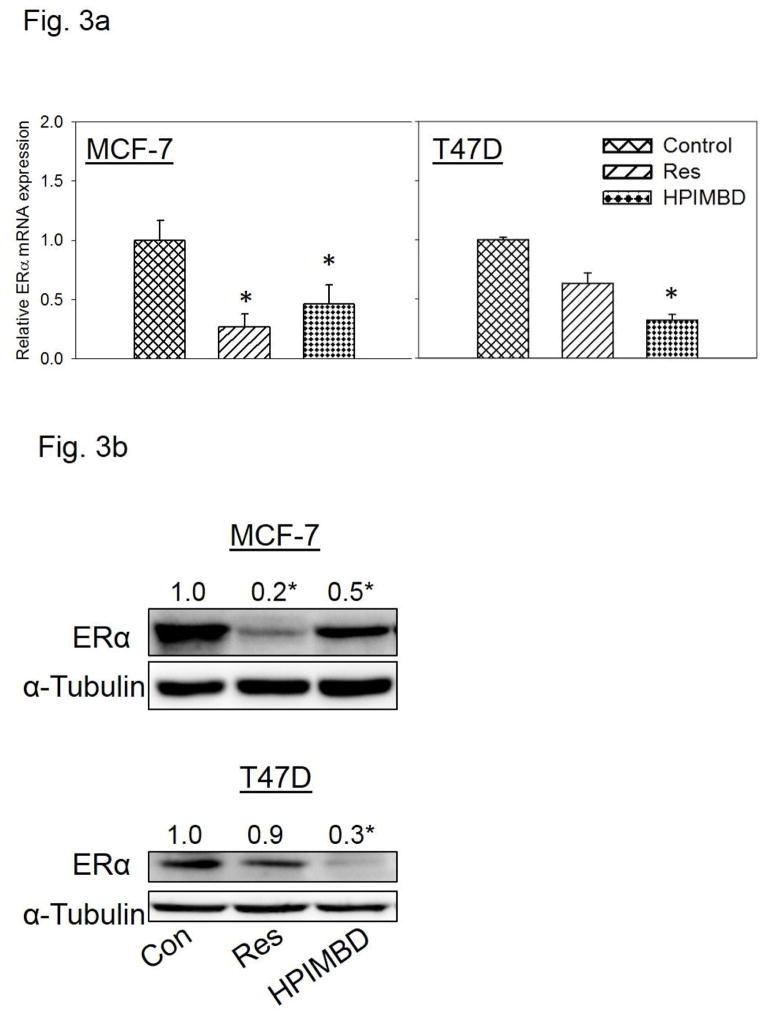
Fig. 3. HPIMBD inhibits mRNA and protein expression levels of ERα.
a) Breast cancer cell lines MCF-7 and T47D were treated with vehicle (DMSO), 50 μM Res or HPIMBD for 24 hours. Total RNA was isolated and reverse transcribed to cDNA. Real-time quantitative PCR was performed to analyze the expression of cyclophilin and ERα mRNA. Expression of ERα mRNA was determined as described in the Materials and Methods section. Each experiment was performed in quadruplicate and the data are expressed as fold change + SEM relative to control.
b) Breast cancer cell lines MCF-7 and T47D were treated with vehicle (DMSO), 50 μM Res or HPIMBD for up to 72 hours. Proteins were isolated and western blot analyses were performed. Fold changes in ERα (Mean + SEM) compared to vehicle-treated controls were calculated from four individual experiments and are given at the top of each blot. Representative western blots are shown for MCF-7 and T47D cell lines after 48 hours of treatments, which is the time point of maximal inhibition of ERα in both the cell lines post-HPIMBD treatment.
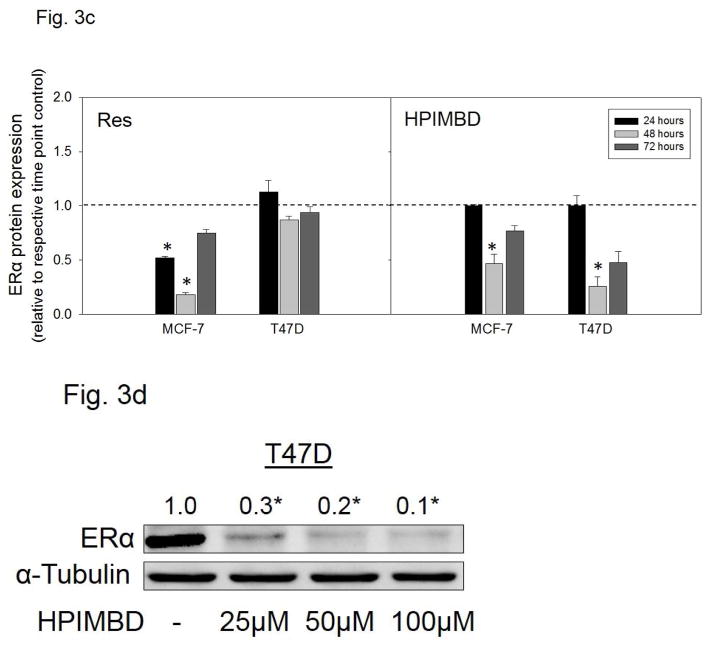
c) MCF-7 and T47D cell lines were treated with vehicle (DMSO), 50 μM Res or HPIMBD for up to 72 hours and a time-course study was performed. Proteins were isolated and western blot analyses were performed. Intensities of the bands were quantified and normalized to α-tubulin. Fold changes compared to vehicle-treated controls were calculated from four individual experiments. The bar graph represents fold change in ERα protein expression (Mean + SEM) in respective cell lines treated with Res or HPIMBD compared to vehicle-treated controls.
d) T47D cells were treated with vehicle or 25 to 100 μM doses of HPIMBD for 48 hours and a dose-response study was performed. Proteins were isolated and western blot analyses were performed. Intensities of the bands were quantified and normalized to α-tubulin. Fold changes in ERα protein expression (Mean + SEM) compared to vehicle-treated controls were calculated from four individual experiments and are given at the top of each blot.
(*) indicates a P value <0.05 compared to controls.


