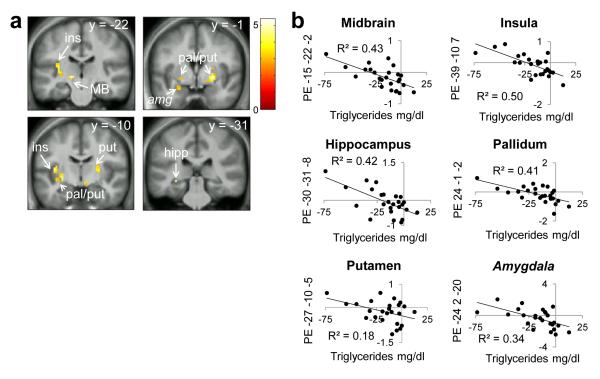
Figure 5.
Triglyceride and preferential responses to milkshake in Hungry vs. Fixed sessions. Ins=insula, MB=midbrain, pal=pallidum, put=putamen, hipp=hippocampus, amg=amygdala (trend). Panels masked with combined a priori ROIs for display purposes. Color bar depicts t-values. a) Milkshake>Tasteless Hungry>Fixed negatively correlated with change in triglyceride levels at 90 minutes from baseline Hungry-Fixed. b) Parameter estimates from the peak voxel in those regions.

