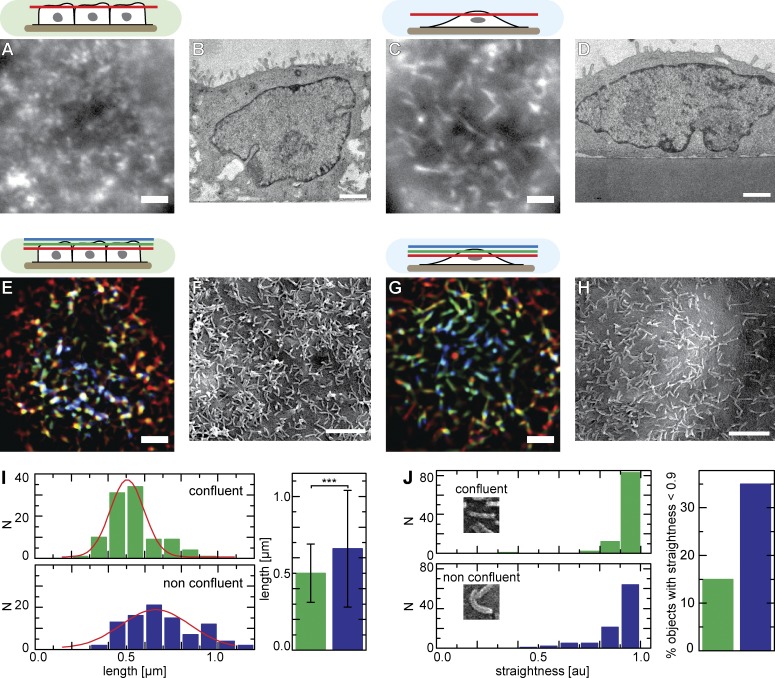
Figure 1.
Apical actin organization of ECs. (A–H) Apical actin organization and surface topology of confluent (A, B, E, and F) and nonconfluent (C, D, G, and H) MDCK cells. Images showing filamentous actin structures labeled with Lifeact-GFP in a single focal plane (A and C) or in projections of three planes covering ∼1.5 µm (E and G) are shown. Transmission EM micrographs show varying numbers of protruding MV (B and D), whereas SEM images reveal the topology of apical MV (F and H). (I and J) Quantitative analysis of the topology of MV imaged by SEM, showing length (I) and degree of straightness (J) for confluent and nonconfluent cells (n = 99; error bars: SDs; t test value: ***, P < 10−10). Red lines indicate Gaussian fits. Bars, 2 µm. Cell shapes and the relative positions of the focal planes shown are indicated schematically with color codes corresponding to structures in E and G. au, arbitrary unit.

