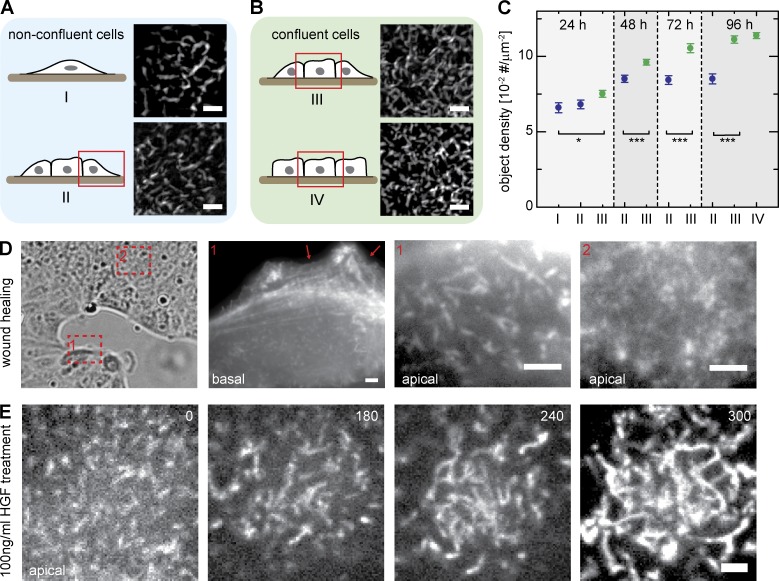
Figure 2.
Factors that influence MV morphology. (A and B) Classification of MDCK cells according to their position within cell layers (schematics and selected regions of representative cells). (C) Relative density of the indicated classes of MV (defined in A and B) in cells cultured for the indicated times. All cells were fixed and stained with Atto 488–phalloidin, and the object density in images was analyzed with an automated computer algorithm (n ≥ 20; error bars: SEMs; t test: *, P = 0.05; ***, P < 0.001). (D) Apical actin organization in a wound-healing experiment. Note the differences between cells at the wound edge (1) and cells within the sheet (2). Arrows indicate basal protrusions. (E) Effects of HGF on apical actin organization (shown here for a single cell). Cells were treated with 100 ng/ml HGF and imaged at different times (given in minutes) after growth factor addition. Bars, 2 µm.

